Over 100 Daily Transits Fall to Near Zero as Strait of Hormuz Shipping Nearly Halts After Weekend Conflict
- Daily ship crossings dropped from 100-plus to fewer than 10 after weekend clashes, MarineTraffic data show.
- The 21-mile-wide chokepoint handles 21% of seaborne oil; any stoppage rattles benchmark Brent and West Texas Intermediate prices.
- Iranian coastline attacks prompted at least three major tanker owners to pause bookings through the strait.
- Insurance war-risk premiums for a seven-day Gulf passage jumped to mid-single-digit percentages of hull value, brokers say.
A single spark in the world’s most crowded oil artery has frozen flows that power factories from Shanghai to Stuttgart.
STRAIT OF HORMUZ—The Strait of Hormuz, just 21 miles wide at its narrowest point, is the maritime jugular of global energy. On a routine Wednesday in May more than 100 vessels—laden supertankers, boxships stacked ten-high with containers, and salt-streaked bulk carriers—thread the two-way traffic lane that skirts Iranian territorial waters.
That rhythm snapped this weekend. Satellite-based Automatic Identification System (AIS) pings tracked by MarineTraffic show that by Monday only eight commercial ships transited the entire 104-nautical-mile corridor, down from 112 the previous Monday. The plunge equals a 93% decline and marks the quietest 24-hour stretch since the service began logging in 2013.
Oil traders reacted instantly. Brent crude futures for July delivery spiked $3.42 to $94.17 a barrel on the Intercontinental Exchange, the highest intraday print since last October. Shipping executives privately warn that if traffic does not rebound within a week, European and Asian refiners will begin drawing on already-tight onshore inventories, accelerating price volatility into the northern-hemisphere driving season.
— Anatomy of a Chokepoint
The Strait of Hormuz is not merely narrow; it is strategically constricted. At its pinch point the navigable width shrinks to barely two nautical miles, forcing very-large-crude-carriers (VLCCs) longer than three football fields to stay inside a 2-km-wide traffic lane while hugging Omani waters. Depths exceed 60 m, adequate for 300,000-dwt supertankers, yet the margin for error is razor thin.
Why 21 miles matters
Twenty-one miles—roughly the length of Manhattan—separates the Iranian island of Qeshm from the Omani fishing village of Khasab. Within that sliver sits the world’s busiest energy highway. The U.S. Energy Information Administration calculates that 17.3 million barrels of crude, condensate and refined products pass through daily, equal to 21% of global seaborne oil trade and about one-third of liquefied natural gas cargoes.
Because alternatives are scarce, any threat—real or perceived—ripples through futures markets within minutes. During the 2019 tanker attacks, insurers temporarily quadrupled war-risk premiums and spot freight for Middle-East-to-Asia VLCCs jumped to $55,000 per day from $25,000. The current standoff has already pushed the Baltic Exchange’s Gulf-to-China benchmark to $68,400 per day, the highest since the Ukraine war’s opening weeks.
History offers sober precedent. In July 1988, after the U.S. Navy downed Iran Air Flight 655, Tehran quietly seeded parts of the strait with sea mines. Commercial traffic fell 25% for three weeks, and Kuwaiti exports alone dropped 600,000 barrels per day, adding a $2 premium to dated Brent. Today’s shutdown is steeper and faster, implying traders fear an even wider escalation.
Forward curves underscore the anxiety. Brent’s front-month contract now trades $5.60 above the six-month future, a structure known as super-contango that signals immediate shortage. “The market is pricing in a non-trivial probability of a prolonged closure,” said Paul Horsnell, head of commodities at Standard Chartered. “If nothing changes within ten days, we could test triple-digit Brent.”
— What the Satellite Data Actually Show
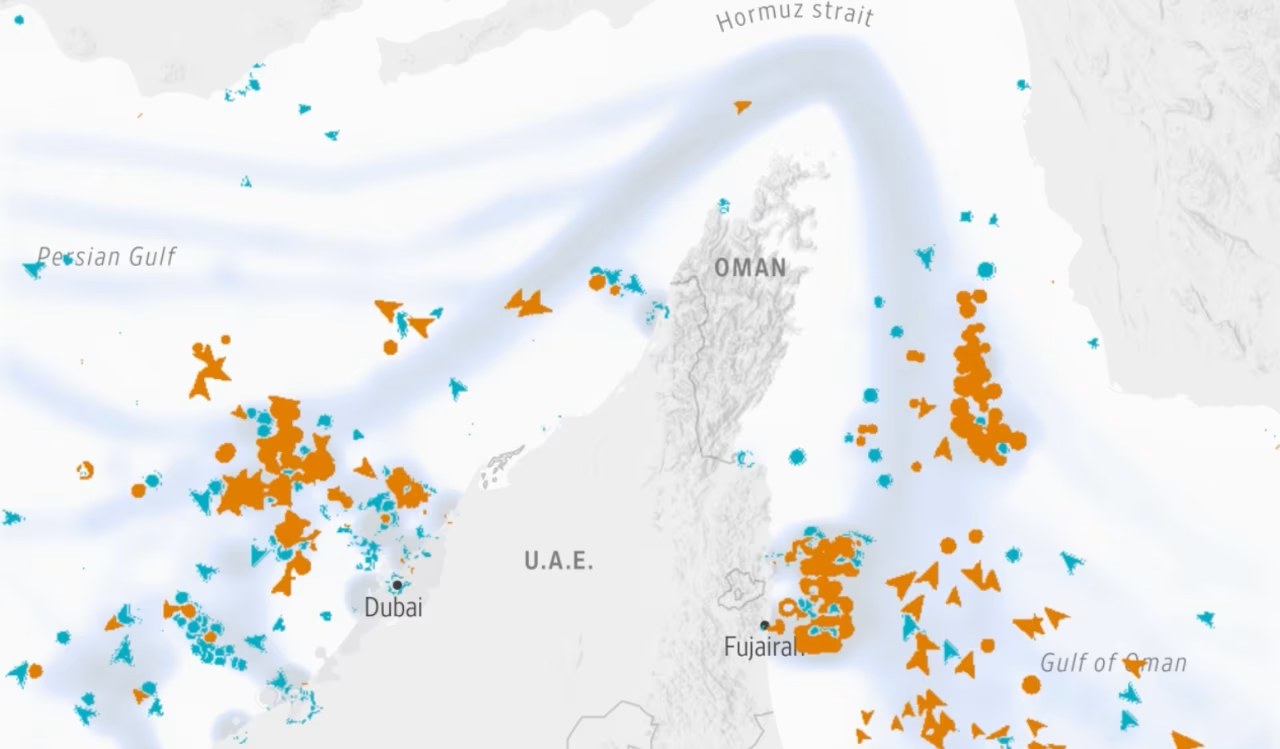
MarineTraffic, a Greek maritime analytics firm, aggregates AIS transponder pings every five seconds from a constellation of 18 low-orbit satellites. Analysts filter for Class-A transceivers—the system mandatory on vessels above 300 gross tonnage—to build a real-time map of commercial traffic. The dataset begins in 2013 and is considered the industry standard for spotter reports.
Counting ships before and after
Between 00:00 and 23:59 UTC on Monday, May 12, the system logged 112 completed southbound or northbound transits of the strait’s Traffic Separation Scheme. Exactly seven days later, following Iranian small-boat swarms and unconfirmed rocket fire near Bandar Abbas, the count collapsed to eight. No typhoon, maintenance closure or holiday explains the gap; weather was 32 °C under light winds.
The composition also shifted. On May 12, 38% of vessels were crude tankers, 21% container ships, 16% bulkers and the remainder product carriers or LPG carriers. On May 19, only two laden VLCCs—Bahri’s Riyadh and China VLCC’s Yuan Yang Hu—completed the passage, both escorted by Panamanian-flagged tug-assist tugs. No boxships above 5,000 TEU transited, indicating liners are quietly rerouting Asia-Europe cargo around the Cape of Good Hope, adding 11 days and $900,000 in fuel per sailing.
Insurance data corroborate the exodus. The Lloyd’s Market Association’s Joint War Committee added Oman and UAE coastal waters to its Listed Areas at 18:00 London time on Sunday. By 09:00 Monday, every underwriter in the marine hull treaty had invoked war-risk clauses, pushing seven-day premiums for Gulf voyages to between 0.75% and 1.25% of insured hull value. On a $90 million VLCC, that equals roughly $1 million for a single voyage—enough to erase the profit on carrying two million barrels of $94 crude.
Container lines are equally skittish. Maersk, MSC and Hapag-Lloyd have all suspended new Gulf bookings through May 31. CMA-CGM still accepts cargo but insists on a war-risk surcharge of $1,200 per forty-foot container, up from $75 last week. “We are seeing the beginnings of a de-facto blockade without a formal declaration,” said Basil Karatzas, head of New York-based Karatzas Marine Advisors. “If nothing changes, shippers will start air-freighting critical spares, and oil will go above $100.”
— Who Controls the Eastern and Western Shores?
Geopolitics is baked into the strait’s geography. Iran commands the entire northern littoral—1,100 km of often mountainous coastline dotted with naval bases at Bandar Abbas, Bandar-e Lengeh and the islands of Qeshm, Larak and Abu Musa. Oman holds the southern periphery, a rugged exclave that ends at the Musandam Peninsula, barely 30 km from Iranian territorial seas.
Tehran’s asymmetric advantage
Iran’s regular navy and the naval arm of the Islamic Revolutionary Guard Corps (IRGC) operate more than 3,000 fast attack craft, according to the International Institute for Strategic Studies. Many are fiberglass speedboats armed with 107-mm rockets, anti-tank guided missiles or limpet mines. In confined waters, swarm tactics can overwhelm a billion-dollar destroyer’s defenses. During the 2019 limpet-mine incidents, the Norwegian-owned Front Altair and Japanese Kokuka Courageous were disabled in less than 90 minutes; U.S. Central Command blamed IRGC units that melted back into Bandar Abbas.
Oman’s posture is deliberately neutral. Sultan Haitham’s government maintains a 23,000-strong military with no offensive strike aircraft; instead, Muscat funds coastal radar chains and a UK-built naval base at Duqm. Oman has repeatedly offered to host U.S.-Iran de-escalation talks, most recently in April. Yet geography gives Muscat leverage: the Omani side of the strait hosts the only two deep-water LNG export terminals in the Gulf—Qalhat and Sur—through which QatarEnergy ships 77 million tonnes per year.
The United States keeps a rotating presence. The Bahrain-based Fifth Fleet’s destroyers patrol the western approach, while the UK’s Royal Navy maintains a permanent frigate or destroyer as part of Operation Kipion. France and Belgium also contribute on occasion. But escorts are thin: on average three allied warships cover 10,000 square kilometers of congested water, forcing commercial skippers to file transit plans 24 hours in advance and maintain 15-knot speeds for maximum maneuverability.
History shows deterrence can fail quickly. In April 1988, Operation Praying Mantis saw U.S. forces sink or damage six Iranian naval vessels after the Samuel B. Roberts struck a mine. Oil prices leapt 9% in two trading sessions even though tanker traffic never fully stopped. Today’s drone and missile arsenals compress decision times to minutes, raising the probability of miscalculation. “A 3-a.m. radar blip can escalate into a regional war before breakfast,” said Caitlin Talmadge, a Georgetown professor who advised the Pentagon on Gulf maritime strategy.
— How Quickly Can Oil Prices Spiral?
Energy economists use a rule of thumb: lose 1% of global supply for 30 days and Brent rises $5–$7. The strait’s 17-million-barrel-per-day throughput equals roughly 17% of world consumption. A total shutdown therefore implies a potential triple-digit price, assuming no strategic reserve releases. But the pathway matters.
Strategic reserves offer a cushion—up to a point
OECD governments collectively hold 1.5 billion barrels in emergency stocks, enough to cover 90 days of net imports under International Energy Agency rules. The U.S. Strategic Petroleum Reserve (SPR) accounts for 363 million barrels, down from 727 million in 2021 after President Biden’s 180-million-barrel sale. Releases can inject 1 million barrels per day for a year, but only if Congress authorizes. China’s SPR size is classified; analysts at OilX estimate Beijing controls 900 million barrels across commercial and strategic sites, roughly 70 days of imports.
Refiners also keep forward cargoes. Singapore onshore inventories, a proxy for Asian spare cover, totaled 46 million barrels last week, according to Enterprise Singapore. That is 5% below the five-year average, leaving little buffer if Gulf supplies vanish. European onshore stocks stand at 483 million barrels, the lowest June level since 2008. “We are starting the summer driving season with inventories well below normal,” said Amrita Sen of Energy Aspects. “Any prolonged strait closure sends Brent toward $110 very quickly.”
Derivatives amplify swings. Net speculative length on Brent futures hit 580,000 contracts last Tuesday, the most since 2018, CFTC data show. Each standard contract covers 1,000 barrels, implying paper demand for 580 million barrels—roughly six days of global output. When headlines turn bearish, algorithmic funds can liquidate within minutes, creating price whiplash. Conversely, fresh geopolitical risk can trigger fresh buying, pushing prices into a self-reinforcing spike.
Emerging-market consumers feel the pain fastest. India imports 87% of its crude; every $1 increase in Brent adds $1.3 billion to the annual import bill, according to the Reserve Bank of India. Jakarta scrapped gasoline subsidies in March; Brent at $100 raises pump prices 15% and risks street protests ahead of regional elections. South Africa’s rand slid 2% versus the dollar on Monday as traders priced in a wider current-account deficit. The feedback loop is clear: higher oil weakens currencies, which in turn makes dollar-denominated crude still more expensive.
— Could a Reroute Emerge—and at What Cost?
Geographers sometimes call the strait “irreplaceable,” but that is not entirely true. Oil can flow via three workaround corridors, each carrying eye-watering price tags and geopolitical strings.
Option 1: East-west pipeline corridors
Saudi Arabia operates the 746-mile Petroline, also known as the East-West Crude Pipeline, with name-plate capacity of 5 million barrels per day from Abqaiq to Yanbu on the Red Sea. Aramco has tested 6.2 million barrels per day, but sustained use above 5.5 million requires additional pumping stations and 12 months of work, consultants at Rystad say. The kingdom also owns 3 million barrels per day of unused Red Sea export berths, so in theory an extra 3 million barrels per day could bypass Hormuz within weeks.
The UAE has the 1.5-million-barrel-per-day Habshan-Fujairah line to the Gulf of Oman. Abu Dhabi completed a $3.2 billion expansion last year, twinning the pipe and boosting capacity from 0.75 million barrels per day. Fujairah’s onshore storage holds 75 million barrels, giving traders room to blend and reload. Yet both Petroline and Habshan-Fujairah terminate south of Hormuz; if the strait is blocked, they remain unaffected. The real bottleneck is inside the Gulf, not outside.
Option 2: Iraqi-Turkish export corridor
Iraq ships 0.7 million barrels per day through the Kirkuk-Ceyhan pipeline to Turkey’s Mediterranean port, but volumes are capped by OPEC quotas and repeated sabotage. Restarting the mothballed 1.6-million-barrel-per-day line would need $5 billion and at least two years, Iraq’s oil minister told Parliament in March. Even then, Kurdish export politics complicate throughput.
Option 3: The long way around
Rerouting tankers around the Cape of Good Hope adds 3,100 nautical miles and 21 days to a Basra-to-Rotterdam voyage. On a VLCC burning 85 tonnes of heavy-fuel oil per day, that equals an extra 1,800 tonnes, or roughly $900,000 at today’s $500-per-tonne delivered bunker price. Freight rates would need to rise another 25% to justify the detour, pushing delivered European crude above $100 even if Brent futures stay flat. Analysts at Energy Intelligence estimate the global fleet can absorb only 1.5 million barrels per day of such reroutes before clean-product tankers begin to cannibalize crude capacity, tightening diesel markets into winter.
Gas is harder. QatarEnergy ships 77 million tonnes per year of LNG—equivalent to 10 billion cubic feet per day—through Hormuz. The only alternative liquefaction plant outside the strait is Oman’s 1-million-tonne-per-year Qalhat train, long since booked to capacity. Diverting Qatari cargoes around the cape is technically feasible but adds 28 days, invalidating most long-term delivery windows and forcing buyers to invoke force-majeure clauses. Japan, South Korea and India rely on Qatari LNG for baseload power; a 30-day delay risks blackouts during peak summer air-conditioning demand.
— What Happens Next?
The coming fortnight will be pivotal. Diplomats in Muscat have floated a 72-hour cessation of small-boat patrols in exchange for a U.S. pledge to withhold additional naval reinforcements. Tehran, smarting under inflation above 40%, has signaled openness but insists any deal must include sanctions relief on oil sales. Washington insists military de-escalation must come first.
Three scenarios dominate desk research at banks
Scenario A: Quick reopening. Under a co-ordinated pause, insurers roll back war-risk premiums to 0.15% of hull value within a week. By early June daily transits rebound to 90–100 ships, though some tanker owners insist on convoys for another month. Brent retreats to $87–$90, erasing most of the geopolitical premium. Probability weighted at 45% by Goldman Sachs.
Scenario B: Partial closure. Iran allows LNG carriers and product tankers to exit while restricting laden crude tankers to national-flag convoys. Roughly 9 million barrels per day of crude would be affected, twice the size of the 1973 embargo. Strategic reserve releases and Saudi pipeline reroutes cover half, leaving a 4–5 million barrel-per-day shortfall. Brent averages $105 for the third quarter, shaving 0.4 percentage points off global GDP, according to Oxford Economics.
Scenario C: Full blockade. Either through miscalculation or deliberate escalation, Tehran mines key lanes or seizes a flagged tanker. The U.S. and allies launch air strikes on coastal radar sites. Maritime insurers impose an effective exclusion zone; traffic falls below 5% of normal. Brent spikes above $130, the IEA coordinates a 2-million-barrel-per-day SPR release, and central banks delay rate cuts to combat inflation. Recession risks rise above 50% for the euro area and Japan. Probability 15% but rising daily, Citigroup says.
Corporate boards are dusting off playbooks. BMW told suppliers this week it will air-freight 1,200 tonnes of critical electronics normally routed through Dubai’s Jebel Ali port. Nestlé has pre-approved chartering two product tankers at fixed rates to secure edible-oil feedstock for Indian factories. Banks from BNP Paribas to MUFG are stress-testing loan books against $120 crude; every $10 increase adds roughly 0.3% to headline CPI in the euro area and 0.4% in South Korea.
Consumers will feel the pinch at the pump. In the U.S. a sustained $15 rise in Brent translates into about 35 cents per gallon of gasoline within six weeks, according to the Energy Department. That would lift the national average above $4, a psychological threshold that historically erodes approval ratings for sitting presidents. In Germany, the ADAC auto club warns that super-unleaded could breach €2 per litre, reviving debates over a 25-cent fuel-tax rebate similar to 2022.
The longer the strait stays shut, the greater the structural fallout. Energy traders say a 30-day disruption would force India to accelerate long-term contracts with U.S. shale producers, permanently shifting market share. European refiners might revive Iraqi Kurdistan crude purchases, complicating Baghdad-Erbil politics. And Qatar could revive the 2004 Dolphin pipeline expansion study to send more gas to Oman and Kuwait, reshaping Gulf energy diplomacy for a decade.
— Key Players to Watch
Navigating the crisis means keeping an eye on a handful of decision-makers whose statements or silence can swing tanker rates overnight.
Iran’s Supreme Leader Ayatollah Ali Khamenei
Khamenei authorized the IRGC navy’s current patrol posture. In a May 18 speech he framed the strait as “our coastal backyard” and hinted that if Iran cannot export oil under sanctions, “others might face hurdles.” Markets read the line as a veiled threat; Brent ticked up $1.40 within an hour of state TV broadcast.
U.S. Fifth Fleet Commander Vice Adm. Charles Cooper II operates from Bahrain with roughly 30 warships. Cooper’s public promise on May 20 to “ensure freedom of navigation” calmed insurers enough to cap premiums at 1.25% rather than 2%. His next move—whether to escort convoys or impose an exclusion zone—will set the tone for allied naval activity.
Sultan Haitham bin Tariq of Oman
Haitham has reopened back-channel talks between Tehran and Washington. Omani diplomats shuttled twice to both capitals this week, offering a phased de-escalation plan that begins with a 72-hour cessation of IRGC fast-boat sorties. Oman’s neutrality gives the proposal weight; the sultanate hosts U.S. overflight rights while maintaining cordial ties with Iran.
International Group of P&I Clubs represents 95% of ocean-going tonnage. The 12-member mutual-insurance association decides whether to keep the strait on its Listed Areas. A senior underwriter told Lloyd’s List that an extension beyond seven days would trigger automatic voyage-notification clauses, effectively requiring shipowners to obtain individual approval for each transit—slowing trade even if shooting stops.
Finally, watch QatarEnergy CEO Saad al-Kaabi. The company’s 77-million-tonne-per-year LNG export schedule underpins Asian power demand. Kaabi has already diverted two cargoes originally bound for the UK’s Isle of Grain to longer-haul Japanese buyers, tightening Atlantic basin supply. If Qatar idles trains, European gas prices could spike above €60 per megawatt-hour, reviving coal burn and complicating EU decarbonization goals.
Corporate actors matter too. Frontline Ltd., the NYSE-listed tanker giant controlled by Norwegian billionaire John Fredriksen, has parked five VLCCs off Fujairah in a floating storage play, betting that rates will rise further. Container titan AP Møller-Maersk has blanked four Asia-Europe sailings through the strait, shifting 120,000 TEU to Cape routes. Their combined market power can tighten capacity even if governments reach a cease-fire.
Frequently Asked Questions
Q: How many ships normally transit the Strait of Hormuz each day?
On an average day more than 100 vessels—tankers, container ships, and bulk carriers—squeeze through the 21-mile-wide Strait of Hormuz, according to MarineTraffic.
Q: Why is the Strait of Hormuz critical for oil markets?
Roughly 21% of the world’s seaborne oil and one-third of global liquefied natural gas exports pass through this chokepoint, so any disruption instantly ripples into global crude prices.
Q: What triggered the latest shipping slowdown?
Open conflict erupted this past weekend along the Iranian coastline; within hours insurers slashed coverage and captains either anchored or rerouted, slashing daily transits from triple digits to single digits.
