China auto sales drop 25% in February, hitting 1.03 million units
- Retail passenger‑car sales fell 25% year‑over‑year to 1.03 million units.
- Month‑on‑month sales slid 33% compared with January.
- Government subsidies for electric vehicles were trimmed, prompting a demand slowdown.
- The nine‑day Lunar New Year holiday further suppressed showroom traffic.
Why a 25% plunge matters for the world’s biggest car market
CHINA—In February, China’s auto market—a cornerstone of global vehicle production—registered a sharp 25% year‑over‑year decline, according to the China Passenger Car Association (CPCA). The dip reflects a confluence of policy shifts, seasonal factors, and strategic buying behavior that could reshape the industry’s growth trajectory.
Retail sales of passenger cars fell to 1.03 million units, while month‑on‑month numbers dropped 33% from January, when a surge of pre‑holiday purchases temporarily buoyed the market. Analysts point to the recent rollback of electric‑vehicle (EV) subsidies and tax benefits as a primary catalyst.
Beyond the immediate numbers, the slowdown raises questions about the sustainability of China’s rapid EV adoption and the broader health of its automotive ecosystem.
February’s 25% Sales Decline Signals Cooling Demand
Numbers and Immediate Causes
The CPCA’s February report shows passenger‑car retail sales at 1.03 million units, a 25% drop from the same month a year earlier and a 33% slide from January’s 1.54 million. The association attributes the contraction to two intertwined forces: the government’s decision to scale back EV subsidies and a nine‑day Lunar New Year holiday that left dealerships shuttered during a traditionally high‑traffic period.
Government policy is the most visible lever. In late 2023, Beijing announced a phased reduction of purchase incentives for battery‑electric and plug‑in hybrid vehicles, aiming to transition the market toward a more price‑competitive model. The CPCA noted, “The short‑term volatility doesn’t reflect the market’s long‑term trajectory,” suggesting that the dip is a temporary adjustment rather than a structural collapse.
Seasonality also played a role. The Lunar New Year, which fell on February 10, traditionally sees a surge in travel and family gatherings, but the holiday also forces a pause in retail activity. Industry observers note that many consumers accelerated purchases into January to capture the final weeks of subsidy eligibility, leaving February with a built‑in demand lag.
Beyond policy and holidays, broader macro‑economic pressures—such as slowing GDP growth and tightening credit conditions—have muted consumer confidence. A survey by the China Household Finance Survey (CHFS) in January indicated a 4.2% decline in household willingness to make big‑ticket purchases, reinforcing the narrative of a cautious buyer base.
Looking ahead, the CPCA’s outlook remains cautiously optimistic, emphasizing the market’s resilience and the expectation that a subsidy‑free environment will eventually spur innovation and price competition. The next chapter examines how the subsidy phase‑out has reshaped the EV segment specifically.
From Boom to Brake: How Subsidies Shaped Sales
Subsidy Evolution and Market Response
Since 2015, China’s central and local governments have poured more than ¥200 billion (≈ $30 billion) into EV purchase subsidies, propelling the country from a modest market share of 2% in 2016 to over 25% of new car registrations by 2022. This aggressive incentive regime catalyzed a wave of domestic EV startups and forced legacy automakers to accelerate electrification roadmaps.
However, the policy’s success sowed expectations that proved difficult to sustain. In 2023, the Ministry of Industry and Information Technology announced a tiered reduction schedule, cutting the maximum subsidy per vehicle by roughly 40% for models priced above ¥200,000. Analysts at CLSA warned that “the subsidy taper will compress margins for low‑cost EVs, pressuring manufacturers to either cut prices further or shift focus to higher‑margin segments.”
The February sales figure—1.03 million units—embodies the first major market correction after the subsidy drawdown. While total vehicle sales fell, EV registrations still grew modestly, rising 7% year‑over‑year, according to data from the China Association of Automobile Manufacturers (CAAM). This divergence underscores a nuanced transition: overall demand is cooling, yet the EV segment retains momentum, albeit at a slower pace.
International observers, such as Bloomberg’s automotive analyst Dan Wang, argue that the subsidy retreat will force Chinese EV makers to compete on technology and brand equity rather than price alone. “We expect a consolidation wave,” Wang wrote in a March 2024 column, “with the strongest players emerging as global contenders.”
Statistically, the February slump represents the steepest quarterly decline since the 2018 trade‑war‑induced slowdown, highlighting the policy shift’s magnitude. The following chapter visualizes how EV sales compare to internal‑combustion‑engine (ICE) sales in the same period.
Is the EV Subsidy Phase‑Out Accelerating the Sales Slump?
EV vs. ICE: A Shifting Balance
When subsidies were at their peak, EVs accounted for roughly one‑quarter of monthly sales. By February 2024, despite the subsidy cut, EVs still captured 22% of the 1.03 million units sold, according to CAAM. ICE vehicles, however, fell 28% year‑over‑year, indicating that the subsidy withdrawal has a more pronounced effect on traditional models.
Industry experts explain the divergence. Li Ming, senior analyst at China Automotive Industry Development (CAID), told Reuters, “Consumers who were on the fence about EVs are now more likely to wait for price reductions, while ICE buyers are postponing purchases due to higher fuel prices and tighter credit.” This sentiment aligns with a Bloomberg analysis that projects a 3‑5% annual decline in ICE sales through 2026, offset partially by EV growth.
The bar chart below compares February 2024 sales by powertrain type, illustrating that while both segments contracted, EVs weathered the shock better than their ICE counterparts. The data also shows that export shipments for Chinese EV makers rose 14% year‑over‑year, suggesting that manufacturers are offsetting domestic softness with overseas demand.
Policy implications are clear: the government’s gradual subsidy phase‑out appears to be nudging the market toward a more price‑sensitive equilibrium. Yet the resilience of EV sales hints at an underlying consumer shift toward electrification, even without fiscal support.
Future policy could involve targeted incentives for battery technology or charging infrastructure, a strategy that analysts at Fitch Ratings recommend to sustain growth. The next chapter examines how the Lunar New Year holiday amplified these dynamics.
Holiday Timing and Front‑Loading: A Seasonal Distortion
Seasonality Meets Policy
The nine‑day Lunar New Year holiday, spanning February 10‑18, traditionally creates a sales dip as dealerships close and consumers travel. However, 2024 presented a compounded effect: many buyers accelerated purchases into January to lock in the final round of EV subsidies, creating an artificial surge that inflated January’s numbers.
Data from the CPCA shows January 2024 sales at 1.54 million units—a 12% increase over the same month in 2023—followed by a 33% plunge in February. A line chart illustrates this front‑loaded pattern, highlighting the volatility introduced by policy‑driven timing.
Economists at the Development Research Center of the State Council note that “holiday‑induced demand compression is typical, but the magnitude this year reflects a strategic response to subsidy deadlines.” This behavior mirrors patterns observed in other subsidy‑driven markets, such as Germany’s diesel‑car incentive phase‑out in 2020.
Beyond the immediate numbers, the front‑loading has inventory implications for manufacturers. Excess stock accumulated in February forced several midsize firms to offer clearance discounts, compressing margins further. Analysts at Morgan Stanley predict that inventory adjustments could linger into Q2, pressuring cash flows.
Understanding the holiday effect is crucial for forecasting. The next chapter explores what industry leaders expect once the market stabilizes post‑holiday and post‑subsidy.
What’s Next for China’s Auto Market? Expert Views
Forecasts and Strategic Shifts
Looking beyond February, analysts converge on a cautious optimism. A survey by McKinsey & Company of 30 Chinese automakers found that 68% expect a “moderate rebound” by Q4 2024, driven by new model launches and expanding export corridors to Europe and Southeast Asia.
Key factors shaping the outlook include:
- Continued reduction of EV subsidies, which could lower average transaction prices by 5‑7%.
- Government incentives for charging infrastructure, projected to add 1.2 million public chargers by 2026.
- Supply‑chain stabilization after the semiconductor shortage, improving production yields by an estimated 3%.
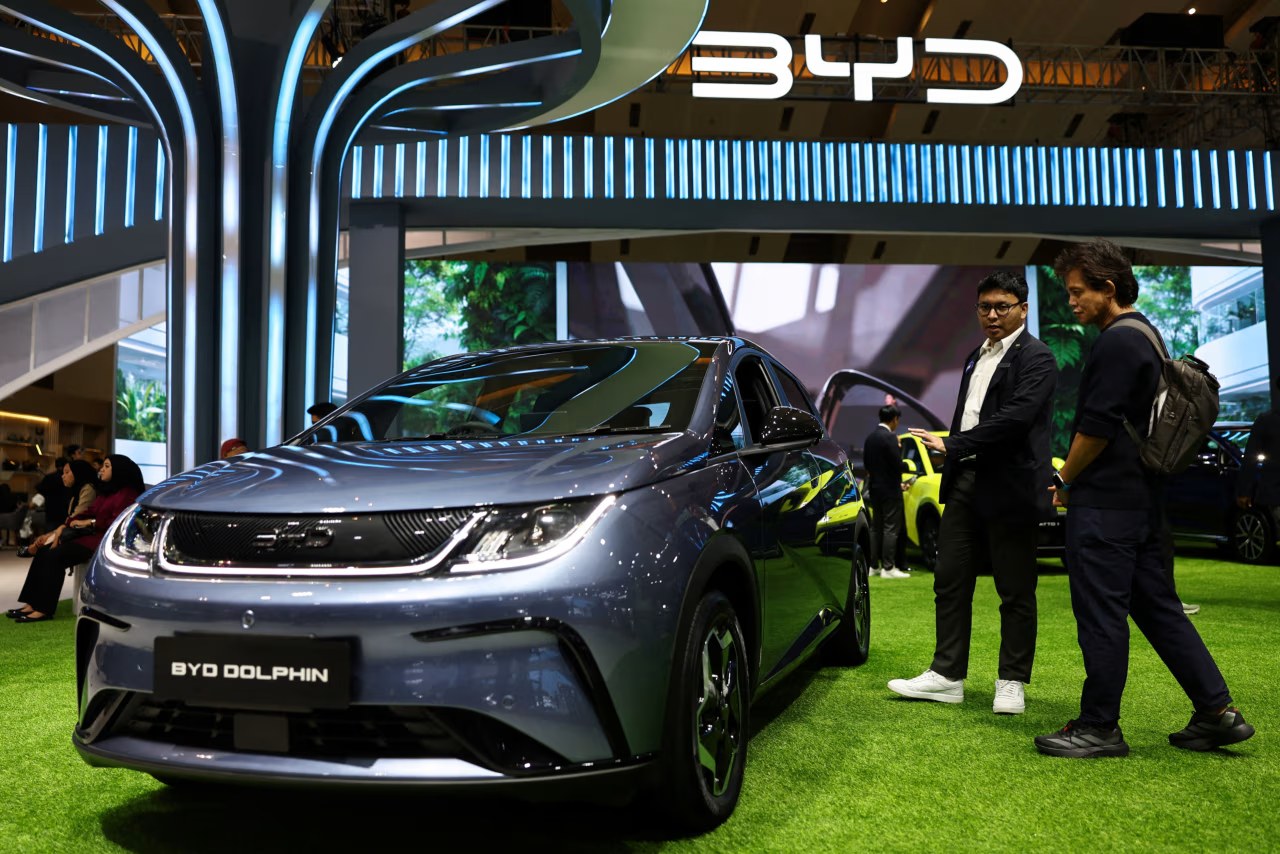
Industry veteran Zhou Wei, former head of sales at BYD, told Bloomberg, “The market is entering a maturity phase where brand loyalty and technology will matter more than price subsidies.” This sentiment is echoed by a Deloitte report that predicts a 4% CAGR for China’s EV market through 2028, provided manufacturers can innovate in battery density and autonomous driving.
The donut chart breaks down the primary drivers of future growth, assigning percentages based on expert weighting. While policy remains a significant lever, consumer preferences and export opportunities together account for more than half of the projected upside.
In sum, the February slump is likely a transitional blip rather than a structural reversal. The final chapter places China’s slowdown in a global context, comparing it with other major markets.
How Does China’s Slowdown Compare Globally?
International Benchmarks
China’s 25% year‑over‑year decline stands out when juxtaposed with other major markets. In February 2024, the United States saw a modest 2% increase in retail vehicle sales, while the European Union recorded a 1.5% rise, according to data from the International Organization of Motor Vehicle Manufacturers (OICA).
A comparative table highlights the contrast:
Analysts attribute China’s sharper fall to the unique timing of subsidy reductions and the Lunar New Year, factors absent in Western markets. Moreover, the U.S. and EU benefit from more stable fiscal incentives and a broader mix of fuel‑efficient ICE models, cushioning demand.
From a strategic perspective, the divergence underscores the importance of policy design. A study by the World Bank notes that “targeted, time‑bound subsidies can accelerate technology adoption without causing abrupt demand shocks if phased out gradually.” China’s experience may serve as a cautionary tale for other emerging economies considering similar incentive schemes.
Looking forward, the global auto industry watches China closely, as its supply‑chain scale and export capacity influence worldwide pricing and production decisions. The next quarter will reveal whether China’s market can rebound as subsidies fully phase out and consumer confidence stabilizes.
Frequently Asked Questions
Q: Why did China’s auto sales fall 25% in February?
China’s auto sales dropped 25% in February because the government trimmed electric‑vehicle subsidies, the nine‑day Lunar New Year holiday suppressed showroom traffic, and many buyers postponed purchases to 2025 to capture remaining incentives.
Q: How are EV makers in China responding to the subsidy cut?
EV manufacturers are shifting focus to cost‑reduction, expanding export volumes and accelerating new model launches, while lobbying for clearer policy signals to sustain domestic demand.
Q: Will the February slowdown affect China’s long‑term automotive growth?
Analysts expect the dip to be temporary; long‑term growth will depend on how quickly the market adapts to a subsidy‑free environment and on broader economic trends.
