Three-Week Slide Erases 1.2% as Oil Tops $103 and GDP Growth Halved to 0.7%
- S&P 500, Dow and Nasdaq all drop over 1.2% for a third consecutive week.
- Brent crude jumps 11% to $103.14, briefly nearing $120 on Monday.
- Commerce Department slashes Q4 GDP to 0.7% from prior 1.4% estimate.
- Fed’s preferred inflation gauge cools but remains above target.
Energy shock meets growth scare, reviving stagflation talk on trading desks.
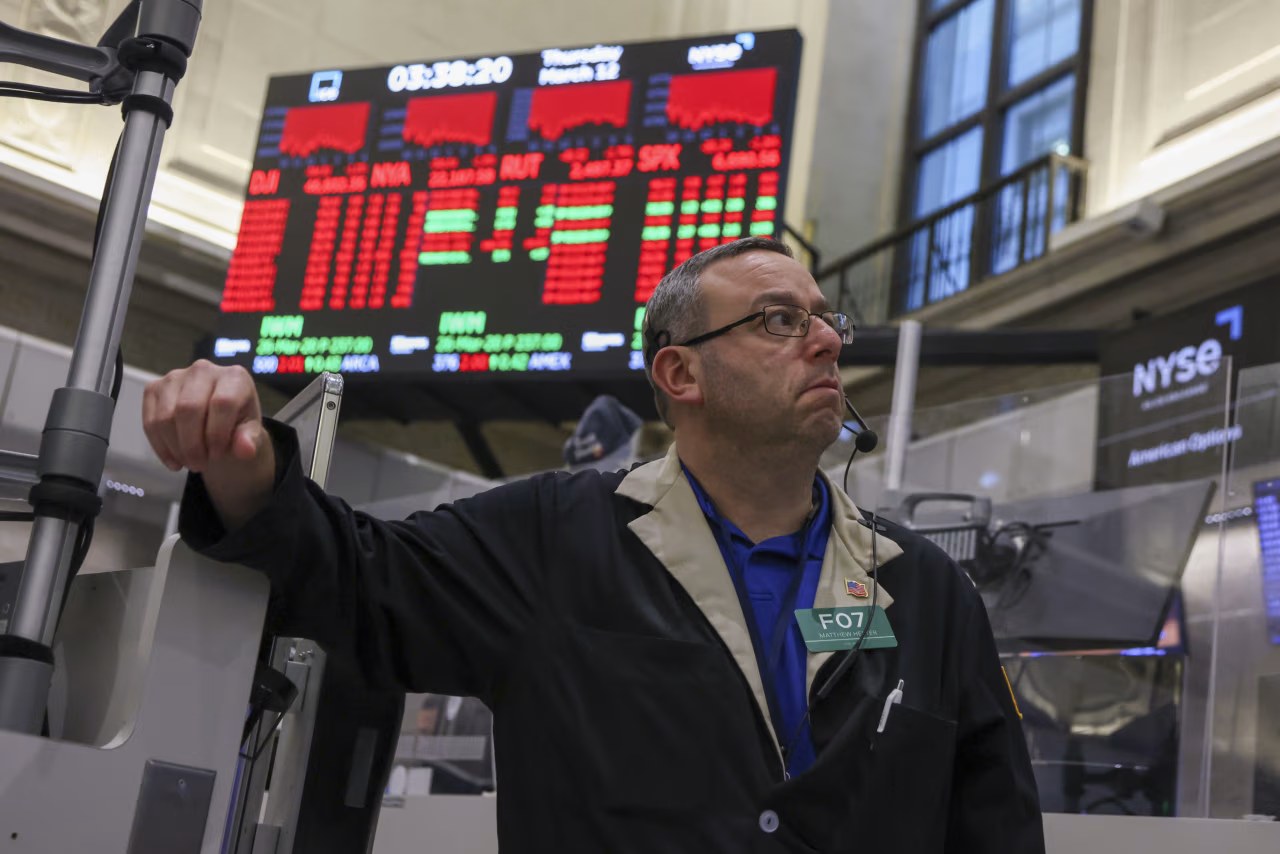
MIDDLE EAST CONFLICT—Wall Street’s selloff accelerated Friday, cementing the longest weekly losing streak since last autumn as crude’s surge above $100 collided with a halved GDP reading. The S&P 500 slipped 0.6% to bring its three-week decline past 1.2%, while the Nasdaq’s 0.9% daily drop underscored tech’s vulnerability to higher energy costs.
Morning optimism sparked by a softer Fed inflation gauge evaporated after the Commerce Department revealed the economy grew at only a 0.7% annual pace in late 2023—half the rate previously estimated—before any Mideast supply disruption. With Brent crude capping an 11% weekly rally at $103.14, investors reassessed earnings assumptions for transport, chemical and consumer-discretionary firms most exposed to fuel bills.
Options markets now price in a 38% chance of a 10% peak-to-trough correction by summer, up from 22% a week ago, according to Cboe data. The VIX volatility index closed above 20 for a fifth straight session, its longest such streak since October.
GDP Revision Exposes Pre-Conflict Fragility
The Commerce Department’s downward revision of fourth-quarter GDP to 0.7% from 1.4% reveals an economy already losing momentum before the latest Mideast hostilities, complicating the Federal Reserve’s inflation fight. Growth in consumer spending was trimmed to 1.4%, while business investment contracted at a 3.8% annual pace, the weakest since the 2022 inventory correction.
Inventory drag and trade deficit overshadowed a modest pickup in housing
inventories subtracted 0.27 percentage points from headline growth, and net exports sliced off another 0.18 points as imports outpaced exports. “The data confirm the economy was on a decelerating path even without an oil shock,” said Lydia Boussour, senior economist at EY-Parthenon, in a client note. She now expects first-quarter GDP to slow further to 0.5% if crude remains above $100.
Crucially, the revision predates the conflict, meaning the 0.7% figure does not incorporate this week’s 11% surge in Brent crude. Every sustained $10 rise in oil shaves roughly 0.3 percentage points from U.S. growth over a year, according to Fed staff estimates. With Brent up nearly $20 since January, the implied drag could eclipse 0.5 percentage points—enough to flirt with technical stagnation.
Equity strategists are cutting S&P 500 earnings-per-share forecasts for 2024 by an average of 2.4%, according to FactSet, with energy-intensive sectors leading the retreat. Airlines, parcel delivery and chemical producers have seen consensus EPS trimmed by 5–7% in just seven trading days. The market’s forward price-to-earnings ratio has compressed to 19.1× from 20.3× at the start of February, yet still screens as expensive relative to a 10-year Treasury yield above 4.2%.
Looking ahead, investors will scrutinize next week’s ISM services index and February payrolls for confirmation that growth is softening without collapsing—a narrow path the Fed calls a “soft landing.” Failure to stabilize data could revive talk of an insurance rate cut by summer, futures that currently imply only 36 basis points of easing by December.
Oil’s 11% Weekly Spike Redraws Sector Map
Brent crude’s 11% surge to $103.14 this week marks the fastest three-day rally since Russia’s 2022 invasion of Ukraine, pushing energy to the top of the S&P 500 sector leaderboard while punishing transport and consumer-discretionary names. West Texas Intermediate ended at $98.71, up 8.6%, after touching triple digits intraday Friday for the first time since October.
Refining margins balloon to $32 a barrel, fastest uptick since Hurricane Harvey
Gasoline futures climbed 12% to $2.89 per gallon wholesale, translating into a national average retail price that could breach $3.50 within two weeks, according to AAA. Diesel’s 14% spike is particularly punitive for freight carriers already grappling with softer freight rates; shares of J.B. Hunt and FedEx fell 4% and 3% respectively on Friday despite broader indices being down less than 1%.
Energy stocks in the S&P 500 jumped 5.8% for the week, the only sector in positive territory. Exxon Mobil and Chevron added a combined $28 billion in market capitalization, while Occidental Petroleum rallied 11% after Warren Buffett’s Berkshire Hathaway disclosed an additional $500 million share purchase. The sector now trades at 11.2× forward earnings, a 44% discount to the broader market, yet analysts at Goldman Sachs argue the gap could narrow if Brent holds above $95 through the spring.
Conversely, airlines led declines with the U.S. Global Jets ETF falling 7%. Every $1 increase in jet fuel equates to roughly $400 million in additional annual expense for the big four U.S. carriers, according to Cowen analyst Helane Becker. Cruise operators Norwegian and Royal Caribbean slid 9% and 8% respectively as investors modeled higher bunker fuel costs against already stretched balance sheets.
Looking forward, the International Energy Agency will publish its monthly oil-market report Tuesday, expected to show global inventories drawing by 1.2 million barrels per day in the first quarter. If confirmed, the tightening backdrop could sustain triple-digit prices even without further escalation, keeping energy outperformance and equity volatility elevated.
Inflation Gauge Cools but Stays Above Fed Target
The Commerce Department’s January personal-consumption-expenditures price index rose 0.3% month-over-month and 2.8% from a year earlier, decelerating from December’s 0.5% monthly clip yet remaining stubbornly above the Federal Reserve’s 2% goal. Core PCE, which excludes food and energy, held at 2.8% year-over-year, matching economists’ median forecast but dashing hopes of a faster disinflation path.
Services inflation ex-housing accelerates to 3.4%, highest since last May
The stickiness stems from insurance, healthcare and financial-services categories where prices rose at annualized rates between 4% and 6%. Fed Chair Jerome Powell flagged “super-core” services as the key hurdle during last week’s congressional testimony, noting that wage growth near 4.5% is incompatible with 2% inflation absent productivity gains.
Futures markets now imply a 64% probability of a first rate cut in June, down from 78% a week ago, according to CME’s FedWatch. The policy-sensitive two-year Treasury yield climbed 14 basis points this week to 4.62%, its highest close since December, while the dollar index rallied 1.1% against major peers.
History shows equity multiples compress when real fed-funds rates turn positive unless earnings accelerate. With the real rate at plus 1.2%, the onus is on corporate profits to justify the S&P 500’s 19× forward valuation. Strategists at BNP Paribas argue every 0.1 percentage-point miss on core PCE could shave 0.5 points off the market’s price-to-earnings ratio if bond yields respond in lockstep.
Next week’s February CPI report will test the narrative. A Bloomberg survey forecasts headline CPI at 3.1% year-over-year, up from 3.0% in January due to base effects, while core is seen slipping to 3.7%. Any upside surprise could push the 10-year Treasury past 4.5%, a level Bank of America says would trigger systematic equity selling by volatility-target funds.
What History Says When War Meets Recession Risk
Since 1970, U.S. equities have fallen a median 7% in the month following a Middle East supply disruption, but losses deepen to 15% when oil spikes coincide with GDP growth below 1%, according to a LPL Financial study of 11 conflicts. This week’s combination of Brent above $100 and Q4 GDP at 0.7% fits the latter profile, raising the probability of a material drawdown.
1973, 1979 and 1990 episodes show earnings, not just multiples, contract when crude doubles
In 1973, the S&P 500 fell 42% peak-to-trough as oil quadrupled and inflation surpassed 11%. valuation multiples compressed from 19× to 7×, but nominal earnings also dropped 6%. Similarly, during the 1990 Kuwait invasion, stocks slid 20% even though the Fed cut rates, because profit margins in transport and chemicals collapsed under fuel costs.
Today’s economy is less oil-intensive—each dollar of GDP now requires 60% less crude than in 1980—yet services sectors are more exposed to wage inflation. Airlines, logistics and chemicals still derive 20–30% of operating costs from energy, while consumer-discretionary firms face a dual hit from higher shipping prices and squeezed real incomes.
Strategists at Goldman Sachs model that every $10 sustained increase in Brent shaves 0.3 percentage points from S&P 500 earnings per share growth. With Brent up $20 since January, the implied 2024 EPS haircut reaches 0.6 points, enough to lower their year-end price target to 4,800 from 5,100 if yields stay elevated.
Forward-looking options skew, measured by the Cboe SKEW index, has jumped to 142, its highest since the Ukraine invasion, indicating demand for crash protection. Investors bought $2.8 billion of put options on SPY this week, the most since March 2023, according to Bloomberg data. The next technical support for the S&P 500 sits at 4,850, 4% below Friday’s close, while resistance is seen at the 50-day moving average of 4,990.
Where Fund Managers Are Hiding as Volatility Spikes
With the VIX above 20 for five straight sessions, active managers have rotated into utilities, healthcare and cash, lifting the defensive cohort to its best weekly relative performance since 2022. The Utilities Select Sector SPDR rallied 2.4%, while the Health Care ETF slipped only 0.1%, outperforming the S&P 500 by 60 basis points.
Cash allocations in AAII survey jump to 22%, highest since SVB crisis
Bank of America’s global fund-manager survey shows cash levels at 4.2%, the highest since October, while allocations to energy and pharmaceuticals are at 18-month peaks. Fund managers cut tech exposure to a net 8% underweight, the largest since 2009, citing both valuation and input-cost risks.
Within healthcare, large-cap pharma is trading at 13× forward earnings, a 32% discount to the market, and offers dividend yields near 3.2%. Eli Lilly and Novo Nordisk bucked the selloff, rising 4% and 3% respectively, as GLP-1 drug demand remains price-inelastic. Defensive positioning has historically outperformed when oil spikes coincide with slowing growth: in 1990, healthcare and consumer staples beat the S&P 500 by 900 basis points over six months.
Quality-factor ETFs, which screen for low debt and stable margins, absorbed $1.1 billion of inflows this week, the most since December, according to FactSet. Gold, another classic hedge, touched $2,045 an ounce, its highest since early January, while the dollar index’s 1.1% weekly gain further pressured emerging-market equities.
Looking ahead, history suggests volatility clusters: once the VIX sustains above 20 for five sessions, it remains elevated for a median of 17 trading days. That implies choppy trading into April unless a cease-fire or OPEC output boost breaks the oil spell. Fund managers say they would need Brent back below $90 and core PCE below 2.5% to re-risk aggressively.
Frequently Asked Questions
Q: Why did stocks fall for a third straight week?
Equities slid as investors priced in a prolonged Middle East conflict pushing Brent crude past $103 and slashing fourth-quarter GDP growth to 0.7%, amplifying fears of stagflation.
Q: How much did the S&P 500 lose on Friday?
The S&P 500 closed down 0.6% Friday, bringing its weekly decline to 1.2% and extending its three-week losing streak amid oil-supply anxiety.
Q: What happened to oil prices this week?
Brent crude surged 11% to $103.14 a barrel and WTI jumped 8.6% to $98.71, with Brent briefly touching nearly $120 on Monday as geopolitical risk premiums widened.
