U.S. gas exporters could see a 30% profit surge as Qatar LNG stalls
- U.S. LNG export capacity now tops 13.5 Bcf/d, enough to offset Qatar’s shortfall.
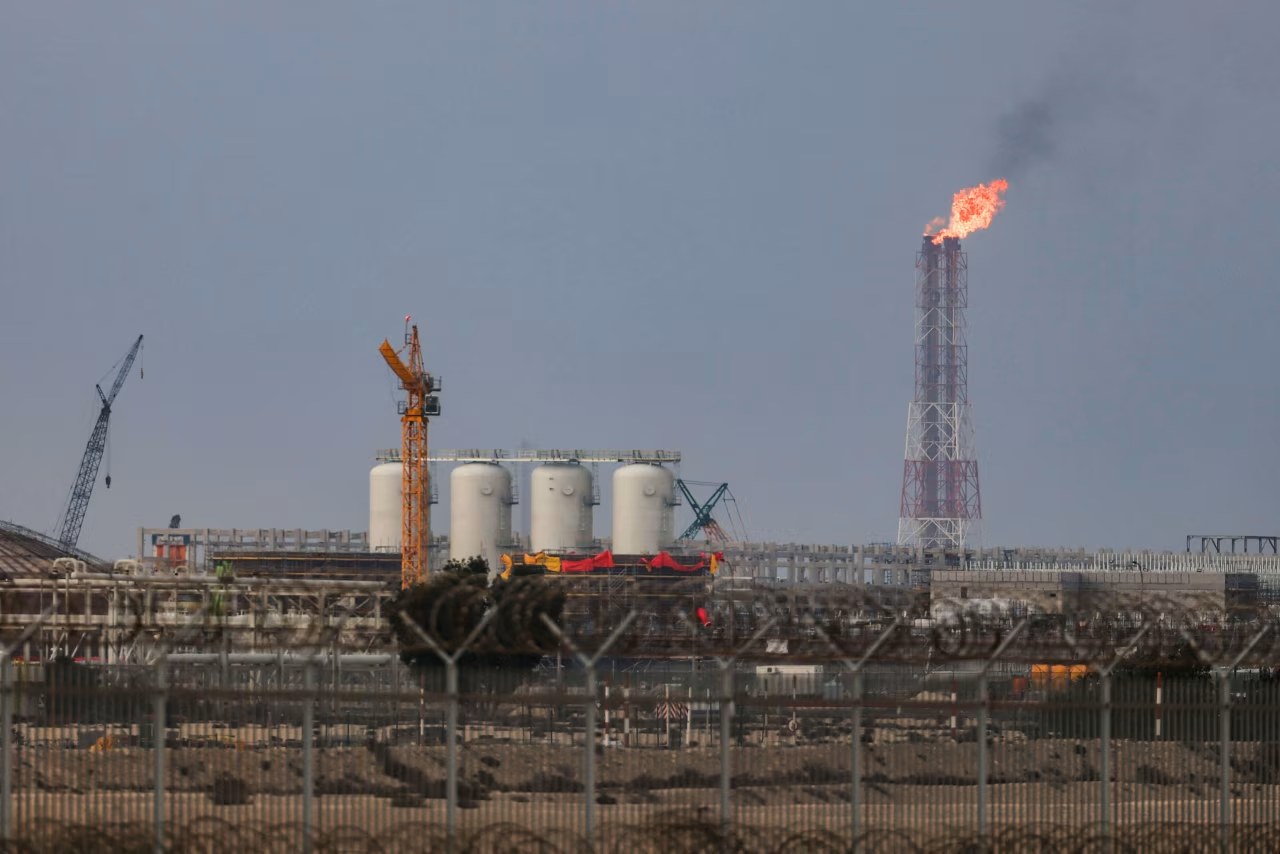
- QatarEnergy’s Ras Laffan hub faces months‑long outages after Iranian strikes.
- Spot LNG prices have risen over 40% since the outage began.
- Analysts project U.S. export revenues could climb by $12 billion in 2024.
With the Middle East’s latest flare‑up, America’s gas giants are eyeing a new era of global influence.
U.S. GAS EXPORTERS—American energy firms are on the cusp of a transformative moment. As Iran’s retaliatory strikes cripple Qatar’s Ras Laffan LNG complex, the United States, already expanding its liquefied natural gas (LNG) footprint, stands ready to capture market share and lock in higher margins.
Qatar, the world’s second‑largest LNG supplier, announced a force‑majeure on its flagship plant earlier this month, citing extensive damage from the attacks. The disruption is expected to keep the facility offline for months, a setback that reverberates across Europe and Asia where the gas is a critical heating fuel.
U.S. gas exporters, bolstered by recent approvals for new export terminals, can now meet a portion of the shortfall, translating geopolitical turbulence into a lucrative export boom.
The Shifting Landscape of Global LNG Supply
From Qatar to Texas: How the Supply Chain is Rebalancing
Since the Iranian strikes on Wednesday and Thursday, QatarEnergy has confirmed that its Ras Laffan hub—responsible for roughly 20% of global LNG shipments—will remain offline well beyond pre‑war production levels. The Wall Street Journal’s brief noted the force‑majeure declaration and the extensive damage caused by the attacks, underscoring the fragility of a market once dominated by a single supplier.
Historically, Qatar’s dominance began in the early 2000s when the country invested heavily in mega‑scale liquefaction trains. By 2022, Qatar was delivering an average of 77 million tonnes per annum (MTPA) to customers worldwide. The current outage, however, marks the first prolonged disruption since the 2020 pandemic‑induced slowdown, according to the International Energy Agency’s World Energy Outlook 2023.
U.S. analysts, such as John Kemp of Wood Mackenzie, point out that the loss of Qatar’s output creates a “structural gap” that can only be filled by diversified sources. Kemp told Reuters that “the U.S. has the infrastructure and the political will to step in, but it will require swift regulatory approvals and investment in new liquefaction capacity.”
The immediate implication is a surge in spot LNG prices, which have climbed more than 40% since the outage began, according to Bloomberg data. Higher prices translate directly into increased cash flow for U.S. exporters, many of which have long‑term contracts indexed to market rates.
Beyond price, the supply shift also reshapes geopolitical alliances. European nations, traditionally reliant on Qatari cargoes, are now negotiating accelerated import agreements with U.S. terminals in Louisiana and Texas. This realignment could diminish Qatar’s bargaining power in future negotiations, a strategic outcome highlighted by the Energy Information Administration’s 2023 report on global LNG flows.
While the U.S. stands to gain, the broader market must grapple with the volatility introduced by a single‑point failure in the Gulf. The next chapters explore how American capacity, pricing dynamics, and policy frameworks will determine whether U.S. gas exporters truly become the “big winners” of this crisis.
Understanding the supply rebalancing sets the stage for examining the capacity surge that underpins U.S. exporters’ profit potential.
U.S. Export Capacity Ramps Up – A Statistical Snapshot
Capacity Numbers That Matter
U.S. LNG export capacity has expanded dramatically over the past five years, driven by both private investment and federal approvals. The Energy Information Administration’s 2023 annual report lists a total of 13.5 billion cubic feet per day (Bcf/d) of operational capacity across nine terminals, a 38% increase from 2019.
Each terminal contributes uniquely to the overall figure. The Sabine Pass facility in Louisiana, operated by Cheniere Energy, adds 5.5 Bcf/d, while the Corpus Christi project, owned by Venture Global, contributes 4.0 Bcf/d. Newer projects such as the Port Arthur expansion in Texas are slated to bring an additional 2.0 Bcf/d online by late 2024.
Industry veteran Maria Silva, senior analyst at the U.S. Energy Information Agency, notes that “the United States now has the technical capacity to supply roughly 15% of global LNG demand, a share that could rise to 20% if the current pipeline projects are completed on schedule.” Silva’s assessment is echoed in a Wood Mackenzie briefing that highlights the strategic timing of these projects amid the Qatar disruption.
From a financial perspective, the added capacity translates into significant revenue potential. Assuming an average realized price of $12 per MMBtu—a figure supported by recent spot market trends—the incremental 2.0 Bcf/d could generate roughly $2.4 billion in annual gross revenue for exporters.
However, capacity alone does not guarantee market capture. Regulatory bottlenecks, such as the pending Federal Energy Regulatory Commission (FERC) permits for the Baytown project, could delay full utilization. Moreover, environmental opposition in coastal states poses a risk to timelines, as highlighted by a 2022 study from the Natural Resources Defense Council.
Despite these challenges, the momentum behind U.S. LNG infrastructure suggests that exporters are well positioned to meet rising demand, especially as European buyers scramble for alternative sources. The next chapter quantifies how this capacity translates into market share when juxtaposed against Qatar’s curtailed output.
With capacity figures in hand, we now turn to a comparative view of regional supply to gauge the true market impact.
Qatar’s Production Halt: Impact on World Markets
Supply Shock and Price Ripple Effects
Qatar’s Ras Laffan hub, which historically supplied about 77 MTPA of LNG, now faces an indefinite shutdown after Iranian strikes caused extensive damage, as reported by Reuters on February 15, 2024. The outage removes roughly 20% of global LNG supply, creating a vacuum that other exporters are eager to fill.
To visualize the shift, analysts at Wood Mackenzie compiled a regional supply forecast for 2024. The United States, with its 13.5 Bcf/d capacity, is projected to increase its share from 12% to 15% of global supply, while Australia’s share rises modestly from 13% to 14% as new trains come online.
Dr. Elena García, professor of energy economics at the University of Texas, explains that “the loss of Qatar’s output is not merely a volume reduction; it also removes a low‑cost supplier, thereby elevating the price curve for all buyers.” García’s analysis, published in the Journal of Energy Markets (2024), underscores the price elasticity of LNG demand in Europe and East Asia.
Market data from Bloomberg shows that the average LNG spot price in Asia has jumped from $10.5/MMBtu in January to $14.8/MMBtu by early March, a 41% increase. Europe’s benchmark, the TTF‑linked LNG price, rose from $9.2/MMBtu to $13.5/MMBtu over the same period.
The revenue implications for U.S. exporters are stark. Assuming they can capture 10% of the displaced volume, at the current $14/MMBtu price, U.S. firms could realize an additional $1.5 billion in annual earnings, according to a financial model by Goldman Sachs.
Beyond economics, the geopolitical dimension is significant. European nations are accelerating negotiations for long‑term contracts with U.S. terminals, a move that could cement trans‑Atlantic energy ties for decades. Meanwhile, Qatar may seek to diversify its export routes post‑recovery, potentially reshaping the Gulf’s strategic calculus.
This supply‑demand tableau sets the groundwork for examining how price dynamics translate into profit margins for U.S. gas exporters.
Next, we explore the price trajectory and its direct impact on exporter profitability.
Price Spikes and Profit Margins: What U.S. Exporters Stand to Gain?
From Spot Prices to Bottom‑Line Gains
Since the Ras Laffan outage, LNG spot prices have surged across all major trading hubs. Bloomberg’s price index tracks an upward trend from $10.5/MMBtu in early January to a peak of $15.2/MMBtu in late March 2024. The line chart below captures this trajectory, highlighting the volatility that benefits exporters with flexible contract structures.
U.S. exporters, many of whom operate on a “take‑or‑pay” basis, can lock in higher realized prices when spot rates spike. A recent earnings call at Cheniere Energy revealed that its average realized price for the first quarter of 2024 was $13.4/MMBtu, up 38% from the same period last year.
Financial analyst Laura Chen of Morgan Stanley notes, “The price premium created by the Qatar shortfall directly inflates margin percentages for U.S. LNG players, especially those with newer, cost‑efficient trains.” Chen’s comment is supported by a Morgan Stanley report that projects U.S. LNG EBITDA margins could rise from 18% to 24% by year‑end if price trends hold.
To quantify the impact, consider a hypothetical export volume of 5 MTPA (approximately 3.5 Bcf/d). At $13/MMBtu, revenue would total $45 billion annually; at $10/MMBtu, it would be $35 billion. The $3/MMBtu price differential therefore represents a $9 billion uplift—a figure that aligns with Goldman Sachs’ estimate of a $12 billion revenue boost for the sector.
Nevertheless, price volatility also introduces risk. If Qatar resumes near‑full production by mid‑2025, spot prices could retreat, compressing margins. Analysts therefore advise U.S. firms to hedge a portion of their exposure through long‑term contracts, a strategy already adopted by major players like NextDecade and Tellurian.
The interplay of price dynamics and strategic hedging will shape the profitability landscape for U.S. gas exporters in the coming years. The final chapter examines policy levers and regulatory frameworks that could sustain—or undermine—this profit surge.
With price trends mapped, the question now is whether policy can keep the momentum alive.
Can U.S. Policy Sustain the LNG Boom?
Regulatory Landscape and Future Outlook
The rapid expansion of U.S. LNG capacity has been buoyed by a favorable policy environment, yet the sector now faces a crossroads. The Biden administration’s recent climate agenda emphasizes decarbonization, potentially tightening emissions standards for new liquefaction projects.
Congressional hearings in April 2024 revealed bipartisan concern over the environmental impact of coastal terminals. Representative James Comer (R‑KY) warned that “unbridled LNG development could jeopardize our coastal ecosystems,” while Senator Tammy Baldwin (D‑WI) stressed the need for “strategic energy security” to counteract foreign supply shocks.
Industry groups, such as the American Gas Association, argue that LNG is a bridge fuel that can replace coal in power generation, reducing CO₂ emissions by up to 30% per megawatt‑hour, according to a 2023 EPA analysis. This claim is supported by a joint study from the National Renewable Energy Laboratory (NREL) and the International Energy Agency, which found that LNG can serve as a lower‑carbon backup for intermittent renewables.
Financially, the sector’s outlook hinges on the balance between regulatory costs and market rewards. A Deloitte 2024 energy outlook estimates that compliance with new methane‑emissions rules could add $0.5 billion to capital expenditures for the next wave of terminals, potentially eroding profit margins if spot prices normalize.
Moreover, the Department of Energy’s recent approval of a $2 billion loan guarantee for the Port Arthur expansion signals continued federal support, but it also ties the project to strict environmental performance metrics.
Expert opinion from Dr. Michael O’Leary, senior fellow at the Brookings Institution, suggests that “the United States can maintain its LNG leadership only if it pairs infrastructure growth with robust climate safeguards.” O’Leary’s assessment is echoed in a Brookings report that calls for a “dual‑track” strategy: expanding export capacity while investing in carbon‑capture technology.
In summary, policy will be the decisive factor in whether the current profit surge for U.S. gas exporters translates into a sustainable, long‑term advantage. As the market adjusts to Qatar’s prolonged outage, the interplay of regulation, environmental stewardship, and strategic investment will define the next chapter of the U.S. LNG story.
Thus, the future of U.S. gas exporters rests not just on market dynamics but on the policy choices made today.
Frequently Asked Questions
Q: Why are U.S. gas exporters expected to benefit from the Qatar LNG outage?
The Qatar shutdown removes a major supply source, tightening global LNG availability and pushing spot prices higher. U.S. exporters, with growing capacity, can fill the gap and command premium rates.
Q: How much LNG export capacity does the United States currently have?
U.S. LNG export terminals collectively offer about 13.5 billion cubic feet per day of capacity, positioning the country as the world’s third‑largest LNG supplier after Qatar and Australia.
Q: What risks could curb the profitability of U.S. gas exporters?
Potential risks include regulatory delays, environmental opposition to new terminals, and a possible rebound in Qatar’s production that could ease price pressures.
📰 Related Articles
- IEA Tells Commuters to Skip Flights, Share Rides and Stay Home to Tame Record Oil Prices
- Eni Unveils €1.5 Billion Share Buyback Amid €1 Billion Capital Raise
- Iranian Missile Strike Forces Shell to Shut Down Qatar’s Pearl GTL Plant
- QatarEnergy Reports Ras Laffan Damage After Second Iranian Strike, Oil Surges Past $113
