US Oil Rig Count Edges Up to 414 as Brent Crude Breaks $110
- Oil-directed rigs rise by two to 414 but trail year-ago tally by 72 units.
- Brent crude gains 2.1% to $110.89/bbl while WTI climbs 2.9% to $98.30.
- Natural gas rigs slip to 131, down two on the week yet up 29 from last year.
- Henry Hub futures retreat 3.1% to $3.07/mmBtu amid milder weather forecasts.
The modest rig rebound signals cautious producer discipline even as global crude benchmarks flirt with triple-digit territory.
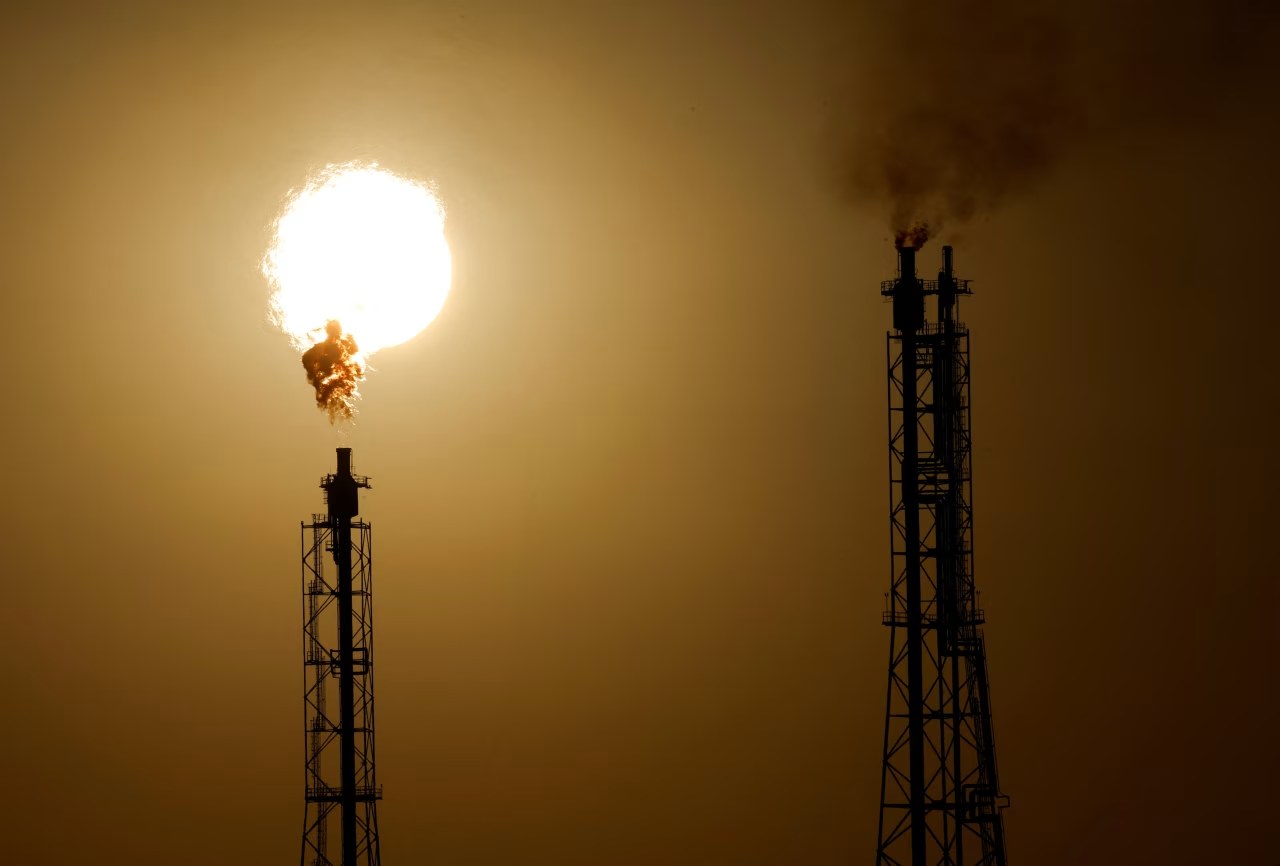
BAKER HUGHES—Baker Hughes’ weekly rotary rig tally released midday shows US oil drilling activity creeping higher, but the 414 active rigs still trail the comparable week in the prior period by 72, underscoring the sector’s muted rebound despite $110-plus Brent prices.
Crude futures rallied after the International Energy Agency flagged persistent supply deficits, pushing Brent to an intraday peak of $110.89 while West Texas Intermediate settled at $98.30. Meanwhile, natural gas futures slid 3.1% to $3.07 as forecasts pointed to softer heating demand across key consuming regions.
Energy equity indexes mirrored the commodity split: the S&P 500 Energy sector rose 1.2%, led by integrated majors and Permian pure-plays, while gas-weighted Appalachia names lagged. Traders now await next week’s EIA drilling productivity report for evidence that higher prices are finally filtering into capital allocation.
Rig Count Pulse: 414 Oil Rigs Signal Cautious Recovery
The two-rig weekly gain masks a 15% year-over-year contraction that belies triple-digit crude prices.
Baker Hughes Co. has tallied US drilling activity every week since 1944, making its release the industry’s pulse check. The latest survey shows 414 rigs targeting oil, up from 412 last week but down from 486 a year earlier. That 72-unit deficit equates to a 14.8% contraction even though Brent has averaged above $100 for the past eight weeks.
Analysts at Tudor, Pickering, Holt & Co. attribute the muted response to capital-discipline vows. “Boards are prioritizing buybacks over barrels,” senior analyst Matt Murphy told clients, noting that the top 15 public E&Ps have guided to flat 2024 budgets despite 20%-plus cash margins. Publicly traded independents account for roughly 60% of the rig fleet, so their spending restraint ripples through the entire count.
Private operators, by contrast, have added rigs steadily since March. Privately held rigs now represent 28% of the total oil fleet versus 21% two years ago, according to Enverus data. Their nimble balance sheets allow them to chase $100 oil, but service-cost inflation—up 18% year-over-year—erodes the incentive. The net result is a rig recovery that lags price signals by the widest gap since 2005.
Forward-looking futures curves offer little encouragement. Brent for delivery in December 2025 trades at $88/bbl, a $22 discount to spot prices that undermines the economics of long-cycle projects. Until curve backwardation eases, analysts expect weekly rig additions to remain measured—likely capping oil-directed counts below 450 through winter.
Why Gas Rigs Defy the Downturn
Gas-directed rigs dip to 131 yet remain 29 units above last year’s depressed base.
Natural gas rigs declined by two to 131 this week, but the bigger picture is a 28% year-over-year gain—the only fossil segment posting growth. The divergence reflects Henry Hub prices that have averaged $3.20/mmBtu in 2023 versus $2.30 in 2022, enough to spur modest activity in the Haynesville and Marcellus shale plays.
BTU Analytics estimates that a $2.75 price covers the median Haynesville well cost, so current futures curves keep a sliver of inventory economic. Private-equity backed operators such as Aethon Energy and Rockcliff Energy have added rigs specifically to feed Gulf Coast LNG terminals scheduled to start up in 2025. Each new 1 bcf/d liquefaction train requires roughly 10–12 rigs worth of associated gas, according to East Daley Analytics.
Still, service bottlenecks loom. Frac-crew availability in Louisiana is booked 92% for the fourth quarter, inflating completion costs by 12% since January. If gas prices slide below $2.90, analysts at Raymond James warn that Haynesville activity could flatten, trimming the rig count back toward 120 by spring.
Longer term, Appalachian pipeline constraints remain the wild card. The Mountain Valley Pipeline’s in-service date has slipped to late 2024, capping Southwest Virginia rig additions. Without new takeaway, Northeast gas rigs may plateau even if prices rally, keeping the national gas count range-bound between 125 and 140 into 2025.
Crude Above $110: How Long Can It Last?
Brent’s 2.1% weekly surge to $110.89 marks the fifth straight triple-digit settlement.
The global crude benchmark has notched its longest $110-plus streak since 2013, propelled by OPEC+ supply curbs and resilient post-pandemic demand. Goldman Sachs commodities chief Jeff Curie told clients that spare capacity has fallen below 2% of global supply, the thinnest buffer since 2004, setting the stage for sustained volatility.
Physical market signals corroborate the rally. North Sea Dated cargoes traded at a $4.20 premium to futures last week, the steepest since Libya’s 2011 civil war, indicating prompt barrels are scarce. Meanwhile, US crude inventories have drawn for seven consecutive weeks, the longest stretch since 2021, according to Energy Information Administration data.
Yet demand headwinds are mounting. China’s refinery throughput slid 3% in September versus August, and European industrial gasoil consumption is down 7% year-to-date. Oxford Economics models suggest Brent could retreat to $85 by mid-2024 if global GDP growth slows below 2%. Until then, geopolitical risk premia centered on Russia and Iran are likely to keep front-month prices anchored above $100.
For US producers, the pricing windfall is clear. At $98 WTI, Pioneer Natural Resources estimates it can cover drilling costs in 4 months versus 7 months at $70. Still, executives like Diamondback Energy CEO Travis Stice reiterate that shareholders, not rigs, will absorb the upside. “We’re not chasing rigs, we’re returning cash,” Stice said at a Houston conference last week, encapsulating the sector’s new mantra.
Gas Futures Slide 3.1%: Is Winter Demand Already Priced In?
Henry Hub futures fell to $3.07/mmBtu as weather models trended warmer.
The sell-off erased two weeks of gains and left prompt-month gas 14% below its late-September peak. The trigger: midday Global Forecast System runs showed heating-degree-days 11% below the 10-year average across the Midwest through late November, stoking fears of a storage surplus.
Working gas in underground caverns stands at 3.55 tcf, 6% above the five-year average, according to the EIA. If winter temperatures mirror the 2019-20 mild season, inventories could finish March near 1.9 tcf—the second-highest end-winter level on record—pressuring summer 2024 prices below $2.50, analysts at Bespoke Weather Services warned.
On the supply side, Lower-48 dry gas output has averaged 102 bcf/d this month, up 4% year-over-year. Appalachia pipelines operated at 92% of nameplate last week, limiting takeaway and capping further output gains. Yet any demand-side disappointment sends ripples through a market that now trades storage risk rather than production scarcity.
Options markets signal caution. The put-call skew for January $3.00 strikes flipped to the most bearish since July, with puts trading at a 12-cent premium, CME data show. Traders are effectively paying $0.12 per mmBtu for insurance against a drop below $3, underscoring the market’s asymmetric downside bias heading into winter.
What Do This Week’s Numbers Mean for 2024 Drilling Budgets?
Capital allocation season looms with boards weighing $90-plus futures against service inflation.
Fourth-quarter board meetings will set 2024 capex benchmarks, and this week’s data will color those debates. At $98 WTI, the average Permian well generates a 42% after-tax internal rate of return, according to Rystad Energy, well above the 25% hurdle most boards target. Yet steel casing costs have risen 22% since 2022, and day-rates for super-spec rigs now fetch $30,000, up from $18,000 two years ago.
Public independents are expected to lift collective spending by just 3% next year, the slowest pace since 2020, per a Cowen & Co. survey of 50 CFOs. The upshot: rig demand growth will hinge on privates and LNG-tied gas drillers, limiting total US additions to 50–70 rigs in 2024—barely enough to offset 4% base decline rates.
Investors have already voted. The S&P 500 Energy sector trades at 8.1× 2024 earnings, a 35% discount to its 10-year average, signaling skepticism that today’s prices are durable. Without a meaningful upward shift in futures curves, next year’s rig count may struggle to breach 500, leaving US oil production growth at a modest 300,000 bbl/d—half 2023’s pace.
Bottom line: this week’s incremental rig additions confirm producers are still in harvest mode, not expansion mode. Unless prices sustain above $100 into spring budget season, the Baker Hughes tally is likely to remain range-bound, keeping global spare capacity thin and geopolitical risk premia elevated well into 2024.
Frequently Asked Questions
Q: How many oil rigs are operating in the US this week?
According to Baker Hughes, 414 rigs are drilling for oil in the US, up two from last week but 72 fewer than a year ago.
Q: What is the current price of Brent crude?
Brent crude futures rose 2.1% to $110.89 per barrel, while light sweet crude gained 2.9% to $98.30.
Q: Did natural gas rigs increase or decrease?
Natural gas-directed rigs dropped by two to 131, yet remain 29 rigs above the year-ago level.
📰 Related Articles
- Gasoline Costs Surge as Persian Gulf War Chokes One-Fifth of Global Oil Supply
- Oil Traders Brace for $180 Brent as Strait of Hormuz Tension Mounts
- Mark Mason Exits Citigroup CFO Role to Chase CEO Seat—Does He Have the Right Résumé?
- Houthis Threaten Red Sea Oil Lifeline as Iran Tightens Grip on Maritime Chokepoints
