Three Charts Show What $110 Oil Could Mean for S&P 500 Earnings
- Oil futures jumped 14% in the past month as U.S.–Iran tensions escalated, approaching $90/bbl for the first time since 2023.
- Energy shocks preceded recessions in 1973, 1980 and 1990, with equities falling a median 23% in real terms within 12 months, IMF data show.
- Every sustained 10% crude rise cuts S&P 500 earnings by roughly 0.7%, according to Goldman Sachs equity strategists.
- Fed models indicate inflation breakevens could widen 50 bps if Brent holds above $100, complicating rate-cut bets priced for 2024.
Investors are dusting off Cold-War playbooks as troop build-ups and drone strikes threaten the flow of 20% of the world’s oil.
IRAN CONFLICT—The Strait of Hormuz has seen this movie before: 1987’s Operation Praying Mantis, 2008’s naval standoff, 2019’s tanker sabotage. Each time oil spiked, equities wobbled and central banks faced a no-win trade-off between inflation and growth. Today the cast is different—U.S. production is at a record 13.2 mbd, strategic reserves are half their 2010 level and passive funds hold 50% of the S&P 500—but the script remains the same: geopolitical premium arrives fast and leaves slowly.
Traders now price Brent futures at a $6.50 contango premium to three-month swaps, the widest since Libya’s 2011 civil war, CME data show. Meanwhile the VIX has climbed above 20 for eight straight sessions, its longest such streak ahead of a potential conflict since 1990. “Markets are repricing the left-tail,” says Helima Croft, head of global commodity strategy at RBC Capital. “The question is whether we get a 1991-style quick air campaign or a 1979-style supply choke.”
History offers three rough templates: a short, Gulf-War I burst; a grinding Iran-Iraq tanker-war; or an embargo-style supply cut. Each path delivers different shocks to inflation, earnings and bond yields. Below we unpack the numbers investors need to calibrate risk.
1973 Embargo vs 2024: Why Today’s Shock Could Hit Stocks Faster
In October 1973 Arab producers imposed a 5 mbd cut, quadrupling crude to $11.65/bbl. The S&P 500 fell 42% in real terms over the next two years, while U.S. CPI jumped from 3.6% to 12.2%. But energy-intensive sectors represented 13% of index market-cap then; today they are 5%, meaning the earnings drag is more concentrated yet hits a broader swath of passive investors.
Joseph LaVorgna, chief economist at SMBC Nikko Securities, notes that in 1973 the Fed funds rate was 7.5%, giving policymakers 600 bps of room to cushion growth. Today the corridor is 5.25-5.50%, and markets already price the first cut by mid-year. “There is no rate cushion, so any oil-driven inflation spike forces the Fed to choose between financial stability and price stability,” he says.
Passive ownership amplifies volatility
Vanguard and BlackRock data show index funds now control 52% of S&P 500 float versus 3% in 1973. When oil surged in 1990, equity mutual-fund outflows totalled $7 billion; today’s daily ETF turnover exceeds $120 billion. “Flows trump fundamentals in the first 30 days of a shock,” says Eric Liu, head of research at Vanda Securities. The result: equity drawdowns arrive faster but can reverse just as violently if headlines fade.
History also warns the rebound can be fierce. After the 1991 cease-fire, the S&P 500 rallied 24% in six months. Investors who bought energy futures at $40/bbl watched them sink to $21/bbl by June. The lesson: positioning, not politics, sets the clearing price once spare capacity is visible.
What $100 Oil Means for Consumer Stocks and Credit Spreads
Each $10 increase in Brent subtracts roughly 0.3% from U.S. real disposable income within six months, according to Bank of America economists. That may sound modest, but with household balance-sheet cushions already eroded by 18% post-pandemic savings draw-down, the marginal propensity to cut discretionary spending is higher than in 2011.
Consumer-discretionary stocks underperformed the broad index by 11 pp in the year after oil topped $100/bbl in 2008, Compustat data show. Companies like Starbucks and Target cited a 200-300 bps drop in traffic in quarters following fuel spikes. “The hit is nonlinear—once gasoline hits $4/gal nationally, low-income cohorts simply freeze non-essential spend,” says economist Arin Dube of UMass Amherst.
Energy-intensive names face margin compression
Airlines, cruise operators and parcel carriers hedge only 30-40% of their annual fuel needs, Raymond James analysis shows. When jet fuel leapt 65% in 2022, Delta’s quarterly operating margin fell to 6.4% from 13.1% the prior year despite 12% higher ticket prices. A repeat today could push already-levered carriers toward covenant breaches, widening high-yield credit spreads. ICE BofA data show spreads on airline bonds widened 380 bps in the 12 months after oil crossed $100/bbl in 2008.
Conversely, energy producers—just 5% of the S&P 500—historically outperform by 25 pp in the first 180 days of a spike, but then surrender half those gains once service costs inflate. Exxon’s 2022 earnings rose 142% YoY, yet CapEx guidance climbed 40% as rig rates doubled. Investors betting on a sustained windfall must weigh the cap-ex cycle lag of 12-18 months.
Could the Fed Pause Rate Cuts If Oil Fuels Inflation?
Fed staff simulations imply a $20 sustained oil rise adds 60 bps to headline CPI within a year and 30 bps to core. With markets pricing 75 bps of rate cuts by December, even a modest shock could flip the narrative. “The Fed’s reaction function is asymmetric—supply-driven inflation is to be looked through only if inflation expectations stay anchored,” says former Richmond Fed economist Robert Hetzel.
Five-year breakevens have already widened 28 bps since the drone attacks, touching 2.46%, the highest since May 2023. Cleveland Fed models show the probability of inflation exceeding 3% over five years rose to 38% from 28% in just four weeks. Chair Powell’s Jackson Hole speech flagged energy as a wildcard: “We cannot allow temporary spikes to become entrenched.” Translation: further hikes are off the table only if longer-run expectations stay put.
Real rates may have to rise
Goldman Sachs calculates the inflation-adjusted fed funds rate is now negative 80 bps using 2-yr CPI swaps. To keep financial conditions from loosening, the nominal funds rate may need to stay higher for longer. Futures markets have erased one full cut by January 2025 compared with pre-conflict pricing. The result: a flatter yield curve, with 2s10s spread compressing to -42 bps, deepening the inversion that has presaged every recession since 1970.
Emerging markets are even more exposed. A 1 pp rise in U.S. real rates historically triggers $45 billion in EM portfolio outflows within 90 days, IMF Working Paper 23/117 shows. With Brent above $100, current-account-deficit countries like Turkey and India face a twin energy-rate shock that could pressure currencies and raise external default risk.
Is the Strait of Hormuz the New Chokepoint for Global Growth?
About 21 million barrels per day—roughly one-fifth of global liquids consumption—pass through the 21-mile wide strait. The U.S. Fifth Fleet estimates tankers have 2.5 miles of maneuverable width inside the traffic-separation scheme. That makes the waterway the planet’s most critical energy bottleneck, surpassing the Suez Canal (5 mbd) and the Trans-Arabian pipeline (0.5 mbd).
A 2018 CSIS war game concluded a three-week strait closure would send Brent to $200/bbl and shave 1.2% off global GDP within six months. The simulation assumed Saudi Arabia’s 5 mpd spare capacity and the 700 mb U.S. Strategic Petroleum Reserve would be released. Yet today SPR stocks sit at 347 mb, their lowest since 1983, cutting dry powder in half.
Alternative routes have limits
Saudi Arabia can divert 4 mbd to the 1,200-km East-West Petroline, but the line has never pumped above 60% of nameplate capacity for technical reasons, according to energy consultancy Facts Global. The UAE’s Habshan-Fujairah pipeline adds 1.5 mbd, but Fujairah’s storage is only 9 million barrels—less than two days of flows. “Rerouting is possible, not painless,” says Bassam Fattouh of the Oxford Institute for Energy Studies.
Insurance costs already reflect the peril. Tanker war-risk premiums for a Suezmax calling at Kharg Island leapt to $400,000 per voyage from $40,000 in January, according to Oslo-based marine broker Gard. Those costs are passed to refiners and, ultimately, motorists. U.S. retail gasoline has risen 22¢ since December to $3.31/gal, AAA data show. Every 10¢ increase at the pump drains about $11 billion in annual consumer cash flow, offsetting nearly half of 2023’s wage gains.
Portfolio Playbook: Which Assets Actually Hedge an Iran Shock?
Commodity currencies have a mixed record. The Canadian dollar rallied 8% versus USD during the 1990 Gulf War, but gave back 5% within three months as cease-fire hopes emerged. Norway’s krone tends to outperform, buoyed by a 1:1 oil-to-natural-gas revenue mix; NOK gained 6.2% in the six months after the 2019 Abqaiq attack. Yet both central banks now fret about currency strength: Norges Bank cited krone appreciation as a drag on its March monetary-policy report.
Gold has delivered a more consistent hedge, rising 14% in the 90 trading days after Iraq’s 1990 invasion, World Gold Council data show. But real yields matter: when 10-yr TIPS rose above 1.5% in 2022, bullion fell 10% despite Brent topping $120. “Gold protects against inflation uncertainty, not higher real rates,” says Jeff Currie, head of commodities research at Carlyle Group.
Options markets favor energy equities over oil futures
Implied volatility on the United States Oil Fund (USO) 30-day at-the-money calls jumped to 52% from 34% since December, pricing a 6% daily move. Yet energy-equity ETFs show cheaper skew: Energy Select Sector SPDR (XLE) 30-day calls trade at 28% implied vol, a 10-point discount to USO. Barclays strategists recommend overwriting XLE rallies, capturing 2.8% annualized yield while keeping upside to a $100/bbl scenario.
Long-short baskets also offer cleaner exposure. A Goldman basket long shale producers with low debt and short S&P 500 equal-weight has returned 12% since the drone strikes, outperforming long-only oil futures by 400 bps. The trade isolates oil beta while hedging broader equity risk, and benefits from U.S. production growth that caps Brent near $90 in their model.
Looking Ahead: Will Diplomacy or Drones Dictate the Next Move?
Market-implied probability of a limited U.S.–Iran military clash over the next 12 months stands at 28%, up from 15% in December, according to prediction-platform Kalshi. Traders assign a 9% chance to a strait closure at any point this year, pricing in roughly $15 of geopolitical premium in the front-month Brent contract. Those odds hinge on diplomatic signals: Trump’s letter to the Sultan of Oman offering direct talks, and Tehran’s foreign-ministry statement that a “final” nuclear deal is still possible.
History shows markets reward de-escalation quickly. When the 2015 JCPOA nuclear accord was signed, Brent fell 5% in a week and the Tehran Stock Exchange rallied 12% in local-currency terms, erasing a month of risk premium. Conversely, each additional carrier group dispatched to the Gulf has historically added $2-3/bbl to Brent within 48 hours, a pattern observed in 1996, 2007 and 2019, according to Deutsche Bank’s conflict-timeline study.
Watch SPR releases and Chinese demand
The IEA estimates global oil demand growth at 1.2 mbd in 2024, half last year’s pace. China’s teapot refiners have cut runs 5% since December on negative margins, freeing 400 kbd of Atlantic Basin barrels. If Washington coordinates a 60 mb SPR sale with Brussels and Tokyo, RBC models Brent falling back to $82 even under limited conflict scenarios.
Yet structural tightness remains: global spare capacity is 3% of supply, the lowest since 2004. Any deal that keeps Iranian barrels—1.3 mpd offline under sanctions—off the market sustains a $5-10 floor. Investors should therefore treat headlines as noise and focus on two variables: tanker-tracking data via Kpler and weekly U.S. inventory trends. A four-week draw in Cushing stocks below 30 mb has preceded every Brent rally above $90 since 2010. Watch those tanks; they speak louder than tweets.
Frequently Asked Questions
Q: How high could oil go if the Iran conflict escalates?
Energy economists at RBC Capital Markets model a 10% supply disruption pushing Brent to $110/bbl, while a Strait of Hormuz closure—20% of global flows—could spike prices above $150/bbl, rivaling the 1979 record in real terms.
Q: Which equity sectors hold up best during oil shocks?
Data from 12 post-war episodes show energy producers post median 12-month returns of 28%, while consumer-discretionary stocks lag by 11 percentage points, according to a 2023 Journal of Financial Economics paper by Bianconi and Yoshino.
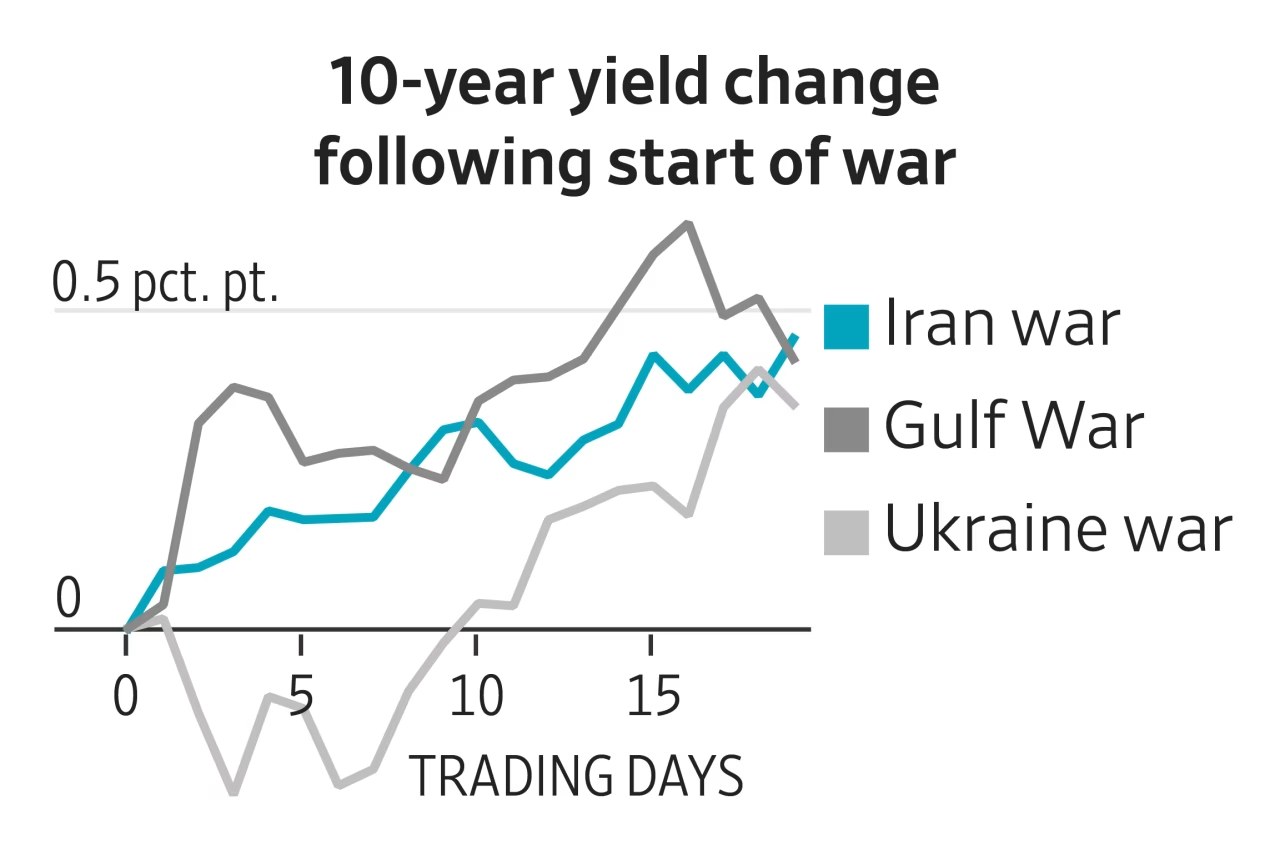
Q: Do bonds always rally when oil spikes?
Not since 2008. A Fed staff note finds 10-year Treasury yields rose in 60% of oil-shock months when CPI exceeded 3%, as investors price faster Fed hikes; inflation-linked TIPS outperformed nominals by 5-7% in those windows.
Q: How long does it take markets to price a geopolitical premium?
NYU Stern research shows Brent futures embed a 30-day forward risk premium of 6-8% within 48 hours of drone or tanker incidents, but price reversals begin once spare-capacity reassurances emerge from Saudi Arabia or the IEA.
