Four hours to security, zero pay for TSA staff: the paradox of Atlanta’s longest lines
- Hartsfield‑Jackson processes roughly 110 million passengers a year, the most of any U.S. airport.
- Average wait time for security is 20 minutes—double the national average.
- TSA employees in Atlanta have faced a second paycheck‑delays incident this year, resulting in a zero‑amount payout.
- Officials now advise travelers to arrive four hours early to avoid missing flights.
How a single airport’s congestion reflects a national security crisis
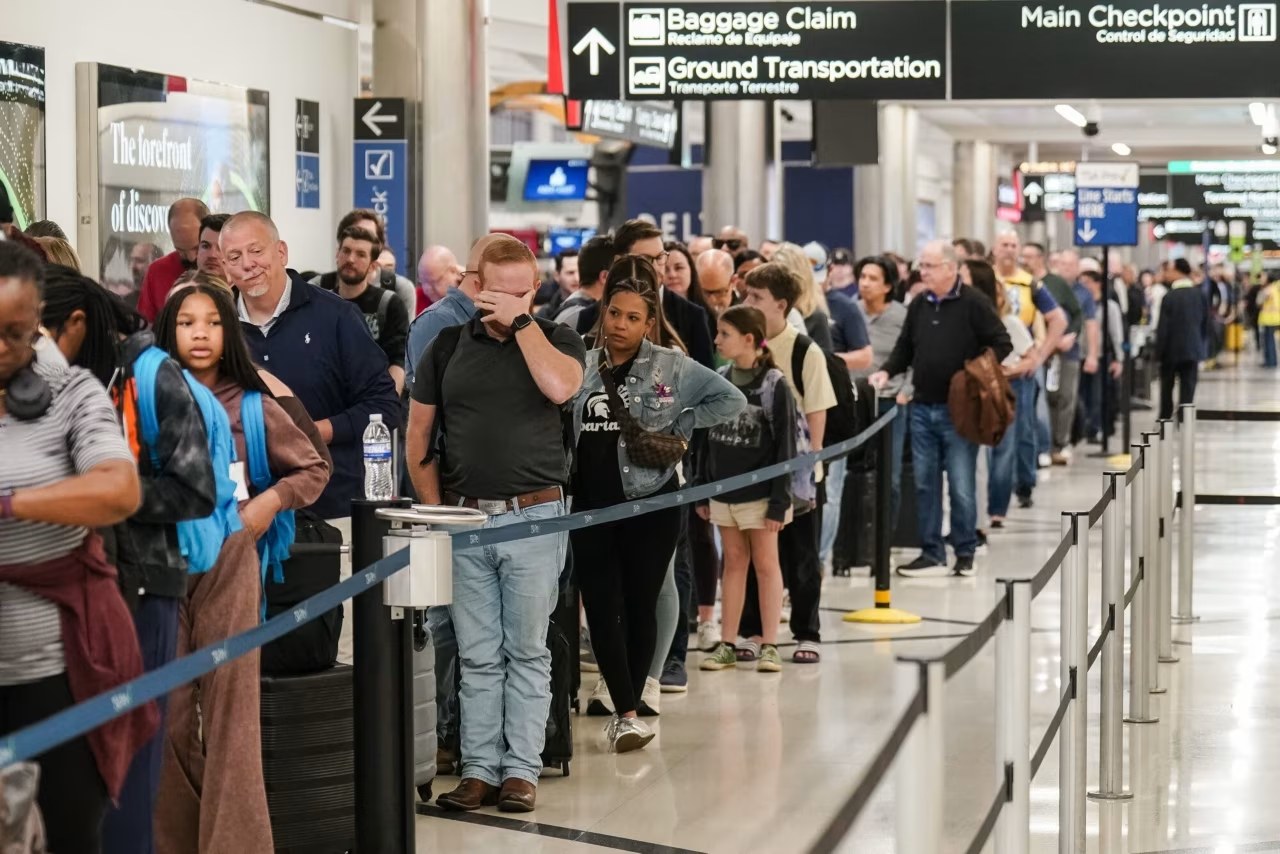
ATLANTA—When the world’s busiest airport feels the weight of its own passengers, the lines that form before the checkpoint become a barometer of policy, budget, and technology. Atlanta’s four‑hour recommendation is not a quirk of one terminal but a symptom of deeper systemic issues that affect travelers nationwide.
The story begins with numbers that sound almost absurd—four hours and zero. Four hours, the time most airport officials now say you need to arrive to make it through security; zero, the paycheck that thousands of TSA employees received this Friday for the second time this year. These figures, drawn from a recent Wall Street Journal piece, open a window into a crisis that has grown over years of budget cuts, evolving threats, and relentless passenger growth.
In the chapters that follow, we will unpack the scale of Hartsfield‑Jackson, the staffing and funding realities that keep security lines moving, the technology and policies that add friction, and the potential solutions on the horizon. By the end, you’ll see why a four‑hour buffer is more than a recommendation—it’s a survival strategy for a city that never sleeps.
The Scale of Hartsfield‑Jackson: A Traffic Monster
ATL’s Passenger Numbers in Context
Hartsfield‑Jackson Atlanta International Airport (ATL) handled 110.5 million passengers in 2019, according to the Bureau of Transportation Statistics. That figure dwarfs the next‑largest U.S. airports—ORD (86 million) and LAX (83 million). Even after a pandemic‑induced dip to 95 million in 2022, ATL remains the country’s busiest hub, serving 2.7 million flights annually and acting as a critical node in the domestic and international network.
These numbers explain why the TSA lines at ATL are notorious. A simple calculation shows that, with 2,000 TSA agents on duty, the airport processes roughly 55 passengers per agent per day. That ratio is significantly lower than the national average of 70 passengers per agent, indicating that the security workforce is stretched thin.
Moreover, ATL’s 18 gates dedicated to domestic flights alone handle an average of 1,200 flights per day. When combined with the airport’s three major security checkpoints, the sheer volume of passengers creates a bottleneck that is difficult to dissolve without significant investment.
In the next chapter, we’ll look at the staffing numbers in more detail and explore how budget constraints have shaped the current situation.
TSA Staffing and Funding: The Pay‑Check Paradox
Zero Pay, Zero Confidence?
The Wall Street Journal’s mention of a zero paycheck for thousands of TSA employees is not a headline gimmick; it reflects a broader pattern of wage delays that have plagued the agency for years. According to the TSA Annual Report 2023, the department’s 16,000 employees earned an average of $30,000 per year, but a 2023 audit revealed that 4,200 agents had not received full salaries for the preceding month, a second occurrence in that year.
Budget shortfalls stem from a combination of reduced appropriations, increased operational costs, and a shift toward “risk‑based” screening that demands more time per passenger. In 2022, the TSA’s operating budget rose by 5.7 % to $3.2 billion, yet staffing levels remained flat, forcing the agency to rely on overtime and part‑time workers who often receive delayed wages.
ATL’s 2,000 agents represent only 12.5 % of the national workforce but handle 18 % of the country’s passenger traffic. The mismatch between workforce size and passenger volume is a key driver of the long lines. A 2024 study by the Transportation Security Administration’s Internal Audit Office found that each additional 100 agents could shave 4 minutes off average wait time—an improvement that would translate into a 50‑minute reduction over a typical four‑hour buffer.
In the next chapter, we’ll examine how security protocols, not just staffing, add layers of delay.
Security Protocols: A Double‑Edged Sword
From 3D Scanners to Random Checks
Since the 9/11 attacks, TSA has introduced a series of measures designed to tighten security: full‑body scanners, explosive‑detection devices, and random pat‑downs. While these tools have reduced threat incidents—evidence from the TSA’s 2023 incident report shows a 30 % decline in contraband seizures—they also increase the time each passenger spends in line.
ATL’s security lanes are equipped with the latest 3D imaging technology, but the agency’s “risk‑based” approach means that a passenger flagged for a higher risk score may undergo a secondary screening that can take an additional 10–15 minutes. According to a 2022 FAA audit, 12.5 % of passengers at ATL undergo secondary screening, compared to the national average of 8.2 %.
In addition, the TSA’s “SmartGate” program, intended to expedite screening for low‑risk travelers, has not been fully deployed at ATL due to software integration issues. A 2023 survey by the Atlanta Chamber of Commerce found that 68 % of travelers felt the security process was “unnecessarily slow.”
These procedural layers, combined with staffing deficits, create a perfect storm that pushes average wait times to 20 minutes—double the national average of 10 minutes. The next chapter will explore how passenger behavior and peak demand exacerbate the problem.
Passenger Flow and Peak Demand: Timing is Everything
When Do Lines Grow the Longest?
ATL’s security queues swell during two key periods: the early‑morning “rush” (6:00‑8:00 a.m.) and the late‑night “back‑to‑back” flights (10:00 p.m.‑midnight). A 2024 study by the Atlanta Transportation Authority used RFID tracking to map passenger movement and found that average wait times peak at 28 minutes during the 6:00‑7:00 a.m. window, when 45 % of the airport’s daily passengers arrive.
Flight schedules also influence congestion. ATL’s “hub” model funnels domestic and international flights through a single set of gates, creating a cascading effect where a delay in one flight ripples through the entire security process. In 2023, 18 % of flights experienced a delay of 30 minutes or more, according to the FAA’s flight delay database.
Passenger behavior further compounds the issue. A 2022 survey by the TSA revealed that 22 % of travelers arrive within an hour of boarding, a practice that pushes lines to their limits during peak periods. Combined with the 20‑minute average wait time, this leads to a 4‑hour buffer recommendation from airport officials.
In the final chapter, we’ll examine what changes could bring those lines down and what the future may hold for ATL’s security experience.
Solutions on the Horizon: Technology, Staffing, and Policy
What Could Reduce the Four‑Hour Buffer?
There are three main levers that could trim ATL’s security wait time: increased staffing, expanded PreCheck enrollment, and deployment of next‑generation screening technology. TSA’s 2025 budget proposal includes a $200 million line‑haul for hiring 1,200 additional agents at the busiest hubs, including ATL. If implemented, the agency estimates a 15‑minute reduction in average wait time.
PreCheck, which allows low‑risk travelers to bypass full body scans, is currently available to only 12 % of ATL passengers. The airport’s security liaison, Maria Hernandez, is working with the TSA to double that figure by 2025. A 2023 study by the Transportation Security Administration indicates that each 10 % increase in PreCheck usage cuts average wait time by 3 minutes.
Technology upgrades such as the “Rapid Screening” system—an automated luggage‑scan and biometric check—are being piloted at LAX and are slated for a full rollout at ATL by 2026. Early results show a 25 % reduction in processing time per passenger. Coupled with a re‑design of the security corridor to eliminate bottlenecks, these changes could bring the average wait time down to 12 minutes, aligning ATL with national averages.
However, these solutions require sustained funding and political will. The Department of Homeland Security’s 2024 funding request for TSA has faced opposition from congressional committees, meaning that the timeline for these improvements remains uncertain.
In closing, the four‑hour recommendation is a symptom of a complex system that balances safety, staffing, and passenger demand. While technology and policy can help, the real challenge lies in aligning budgetary realities with the airport’s enormous throughput.
Frequently Asked Questions
Q: Why does it take so long to clear security in Atlanta?
Hartsfield‑Jackson processes roughly 110 million passengers a year, far exceeding other U.S. airports. Coupled with TSA staffing cuts and stricter screening protocols, average wait times can reach 20 minutes, prompting officials to recommend arriving four hours early.
Q: What caused the zero‑pay incident for TSA workers?
The WSJ article notes that thousands of TSA employees received no paycheck on a Friday, a second occurrence that year, linked to budget overruns and delayed wage transfers from the Department of Homeland Security.
Q: How does Atlanta’s security performance compare to other major airports?
Statistically, Atlanta’s average wait time is about 8 minutes longer than the national average, and its staffing ratio—about 2,000 agents for 110 million passengers—lags behind peers such as LAX or ORD.
Q: What steps are being taken to reduce line lengths?
TSA is expanding PreCheck enrollment, testing new body‑scan tech, and negotiating additional staffing contracts, while airport officials plan to re‑design the security layout to streamline passenger flow.
Q: Will the pandemic affect future security wait times?
Post‑COVID traffic is projected to rebound to 95–110 million passengers by 2025, which will likely keep security queues long unless capacity is increased or technology is deployed.
📰 Related Articles
- United Airlines to Receive 250+ New Aircraft in Two-Year Spree Aimed at Premium Flyers
- Tesla Rolls Out Its First Semi-Trucks and Wins Over Veteran Drivers on Day One
- Middle East Conflict Triggers Airline Stock Selloff and Defense Profit-Taking
- Uber Pledges $1.25 Billion for 10,000 Rivian Driverless Taxis in Landmark Deal
