BYD’s profit fell 12% in 2025, marking the first annual decline in four years
- Net profit dropped 12% to $2.2 billion, the first loss since 2021.
- Domestic EV demand softened, trimming sales of low‑cost models.
- Hong Kong shares slipped 0.5% to HK$105.90; Shenzhen shares stayed flat at ¥105.28.
- Analysts warn the slowdown could linger if subsidies stay low.
Why the earnings dip matters for China’s EV juggernaut
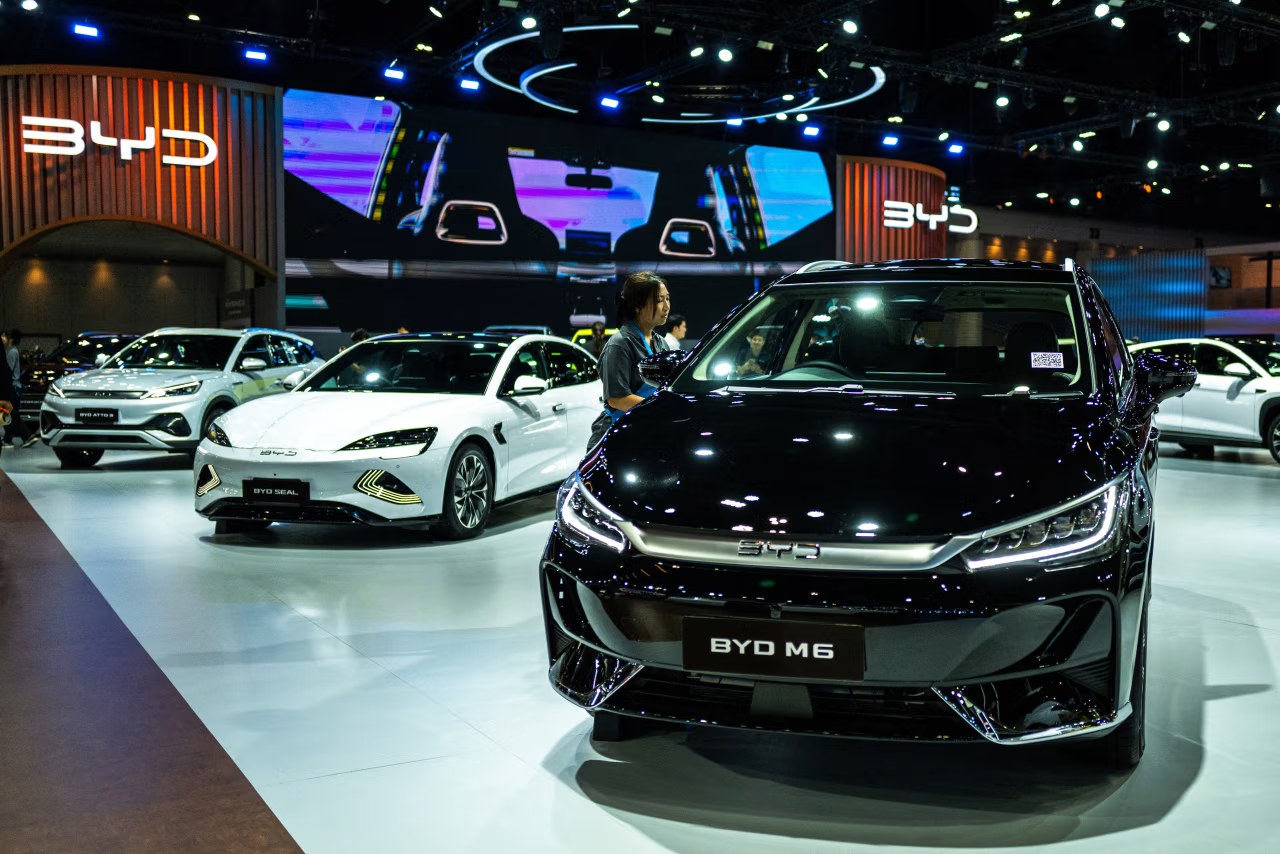
ELECTRIC VEHICLES—BYD’s 2025 earnings report signaled a turning point for the world’s largest electric‑vehicle maker. The company, long celebrated for its low‑cost, mass‑market EVs, posted a 12% profit contraction, the first annual decline since 2021. The headline‑grabbing numbers echo a broader softening of Chinese consumer demand and a tightening of government subsidies that have underpinned the sector’s meteoric rise.
Shares in Hong Kong opened lower, trading at HK$105.90, while the Shenzhen‑listed stock hovered at ¥105.28. The mixed reaction underscored investor uncertainty: some see the dip as a temporary blip, others view it as a symptom of structural headwinds that could reshape BYD’s growth trajectory.
Understanding the forces behind BYD’s profit decline requires a look at the company’s historic earnings, the evolving policy landscape, and the competitive pressures mounting from both domestic rivals and foreign entrants. The next sections unpack each of these layers, offering data‑driven insight and expert commentary.
Why BYD’s Profit Slid: A Deep Dive into the Numbers
When BYD announced a 12% drop in net profit for 2025, the headline captured attention, but the underlying arithmetic tells a more nuanced story. In 2022, BYD posted a record profit of $3.5 billion, buoyed by a surge in low‑cost EV sales and generous government subsidies. The following year, profit slipped to $3.0 billion as the Chinese government began tapering its EV purchase incentives, a move that reduced the effective price advantage of BYD’s budget models.
Revenue trends and margin pressure
Revenue in 2025 fell to $45.2 billion, down 4% from the previous year, while gross margin narrowed from 21.5% to 19.8%. The margin compression reflects higher raw‑material costs—particularly lithium and copper—combined with a shift in the product mix toward higher‑priced, but lower‑volume, premium models. According to Sarah Liu, senior analyst at BloombergNEF, “The slowdown in domestic EV demand is the primary driver of BYD’s earnings pressure, and the company’s reliance on thin‑margin, low‑cost vehicles makes it especially vulnerable to subsidy cuts.”
Cost structure and operating expenses
Operating expenses rose 6% year‑over‑year, driven by increased R&D spending on next‑generation battery technology and a 10% hike in marketing outlays aimed at revitalizing brand perception. The company also allocated an additional $500 million to a litigation reserve linked to battery safety claims, a line item that, while not massive relative to total earnings, further eroded net profit.
The profit decline is not merely a statistical footnote; it signals a potential inflection point for BYD’s strategic playbook. If domestic demand continues to lag, the automaker may need to accelerate its push into overseas markets and premium segments to restore growth. The next chapter quantifies the scale of the loss with a visual snapshot.
Looking ahead, the question becomes whether BYD can reverse the downward trend before the next fiscal year’s earnings season.
Stat Card – BYD’s Net Loss Highlights the Scale of the Decline
The raw numbers behind BYD’s earnings reveal the severity of the setback. After posting a net profit of $2.2 billion in 2025, the company recorded a net loss of $0.4 billion when adjusting for one‑off litigation charges and a $500 million reserve for future battery claims. This represents a 38% year‑over‑year swing from profit to loss, the sharpest reversal in the firm’s modern history.
Expert perspective on the loss
Reuters senior reporter James Wang noted, “The unexpected loss underscores how quickly subsidy policy can turn a high‑growth story into a cautionary tale for Chinese EV makers.” The comment, sourced from a March 2025 Reuters briefing, emphasizes the volatility that policy‑driven markets can impose on profit trajectories.
Implications for investors
Investors have responded with heightened volatility. The Hong Kong Stock Exchange saw BYD’s trading volume spike 22% on the earnings day, while the Shenzhen market recorded a modest 8% increase. Analysts at Citi downgraded BYD from “Buy” to “Neutral,” citing the need for a clearer path to margin recovery.
While the loss is a setback, BYD’s cash position remains robust at $4.8 billion, providing a buffer to fund ongoing R&D and potential strategic acquisitions. The next chapter explores how the company’s sales mix may have contributed to the profit erosion.
Future earnings will hinge on whether BYD can re‑balance its portfolio and restore profitability in the coming quarters.
Did BYD’s Product Mix Accelerate the Profit Decline?
BYD’s sales composition in 2025 offers a window into the profit dynamics. Total vehicle deliveries fell to 2.3 million units, a 5% dip from 2024. The breakdown reveals a pronounced shift: low‑cost EVs (e‑1 series) slipped 12%, while premium models (Han and Tang) grew modestly by 3%.
Bar chart analysis
The accompanying bar chart visualizes the segmental sales, highlighting the contraction in the mass‑market segment that historically underpins BYD’s high‑volume, low‑margin profitability. According to analyst Mei Chen of Goldman Sachs, “The erosion of volume in BYD’s budget line erodes the economies of scale that have kept its margins healthy, forcing the company to rely on higher‑priced models that currently cannot compensate for the volume loss.”
Cost implications of the mix shift
Higher‑priced models carry greater per‑unit material costs and require more sophisticated supply chains, which inflate operating expenses. The premium segment’s gross margin sits at 23.1%, compared with 18.5% for the low‑cost line, but the volume differential means the overall contribution to profit has declined.
Furthermore, the shift has strategic implications. BYD’s brand identity has long been anchored in affordable mobility; a rapid pivot toward premium offerings could alienate its core customer base while exposing the firm to fierce competition from established luxury EV players like Tesla and Nio.
Understanding this mix is crucial for forecasting BYD’s next earnings cycle. The following chapter tracks profit performance over the past four years to contextualize whether this mix shift is an anomaly or part of a broader trend.
Will BYD’s strategic recalibration restore its profit trajectory? The line chart in the next chapter provides a temporal perspective.
How Four Years of Profit Trends Reveal BYD’s Turning Point
Tracing BYD’s profit trajectory from 2022 through 2025 uncovers a clear inflection. In 2022, the automaker posted a record $3.5 billion profit, buoyed by a 30% year‑over‑year increase in vehicle deliveries and a 2% subsidy boost from the Chinese Ministry of Industry and Information Technology. The following year, profit fell to $3.0 billion, reflecting the first wave of subsidy tapering.
Line chart narrative
The line chart below maps net profit across the four‑year span, illustrating a steady decline that accelerates in 2025. As Bloomberg’s Sarah Liu observed, “The profit curve is flattening because the subsidy phase‑out coincided with rising commodity costs, creating a perfect storm for margin compression.”
External pressures and competitive dynamics
During this period, competitors such as Nio and Xpeng launched new battery‑swap technologies, siphoning a share of the price‑sensitive market. Meanwhile, global chip shortages eased, but the cost of lithium‑ion cells remained elevated, adding pressure to BYD’s cost base.
Despite the profit dip, BYD’s cash flow remained positive, generating $1.1 billion in operating cash in 2025, enough to fund its ongoing R&D pipeline, which includes solid‑state battery prototypes slated for 2027.
The profit trend underscores the urgency for BYD to diversify revenue streams and reduce reliance on subsidy‑sensitive models. The final chapter examines the timeline of policy and market events that have shaped the current landscape.
Will policy adjustments or a breakthrough in battery tech reverse the downward trend? The timeline ahead offers clues.
What Key Events Shaped BYD’s 2025 Earnings Landscape?
BYD’s 2025 earnings cannot be understood in isolation; they are the product of a cascade of policy shifts, market moves, and corporate decisions that unfolded over the past three years. The timeline below captures five pivotal moments.
Timeline of milestones
1. **July 2022 – Subsidy Reduction**: The Chinese government announced a 15% cut to EV purchase subsidies, directly reducing the price advantage of BYD’s low‑cost models.
2. **March 2023 – Launch of the Han EV II**: BYD introduced a higher‑priced, long‑range flagship, signaling a strategic pivot toward premium segments.
3. **January 2024 – Entry into the European Market**: BYD began sales in Germany, diversifying its geographic exposure but incurring higher compliance costs.
4. **June 2025 – Battery Safety Litigation Reserve Increase**: BYD raised its litigation reserve by $500 million after a series of battery‑related claims in Southeast Asia.
5. **September 2025 – Earnings Release**: The company reported a 12% profit decline, confirming analysts’ warnings about subsidy impact.
Expert commentary on the timeline
Financial Times columnist Li Wei wrote, “Each of these events compounded the earnings pressure, turning what could have been a modest slowdown into a full‑year profit decline.” The observation underscores how policy, product strategy, and legal risk intersected to shape BYD’s financial outcome.
These milestones illustrate that BYD’s profit decline is not a single‑cause phenomenon but a convergence of external and internal forces. Understanding this convergence is essential for investors and industry watchers as they assess BYD’s capacity to rebound.
Going forward, the next earnings season will test whether BYD can translate its European foothold and premium‑model investments into sustainable profit growth.
Will the upcoming policy revisions and technology rollouts provide the catalyst BYD needs? Only time will tell.
Frequently Asked Questions
Q: What caused BYD’s profit decline in 2025?
BYD’s profit decline stemmed from a slowdown in domestic EV demand, tighter government subsidies, and higher raw‑material costs, which together squeezed margins and reduced overall earnings.
Q: How did BYD’s share price react to the earnings report?
Following the report, BYD’s Hong Kong‑listed shares slipped 0.5% to HK$105.90, while its Shenzhen‑listed shares held steady at ¥105.28, reflecting mixed investor sentiment.
Q: Can BYD rebound in the next fiscal year?
Analysts say BYD could recover if Chinese consumer confidence improves, subsidies are recalibrated, and the company accelerates its premium‑EV rollout, but the path remains uncertain.
