Latest CPI and PCE Inflation Indexes Diverge by 0.6 Points, Forcing Fed to Wait
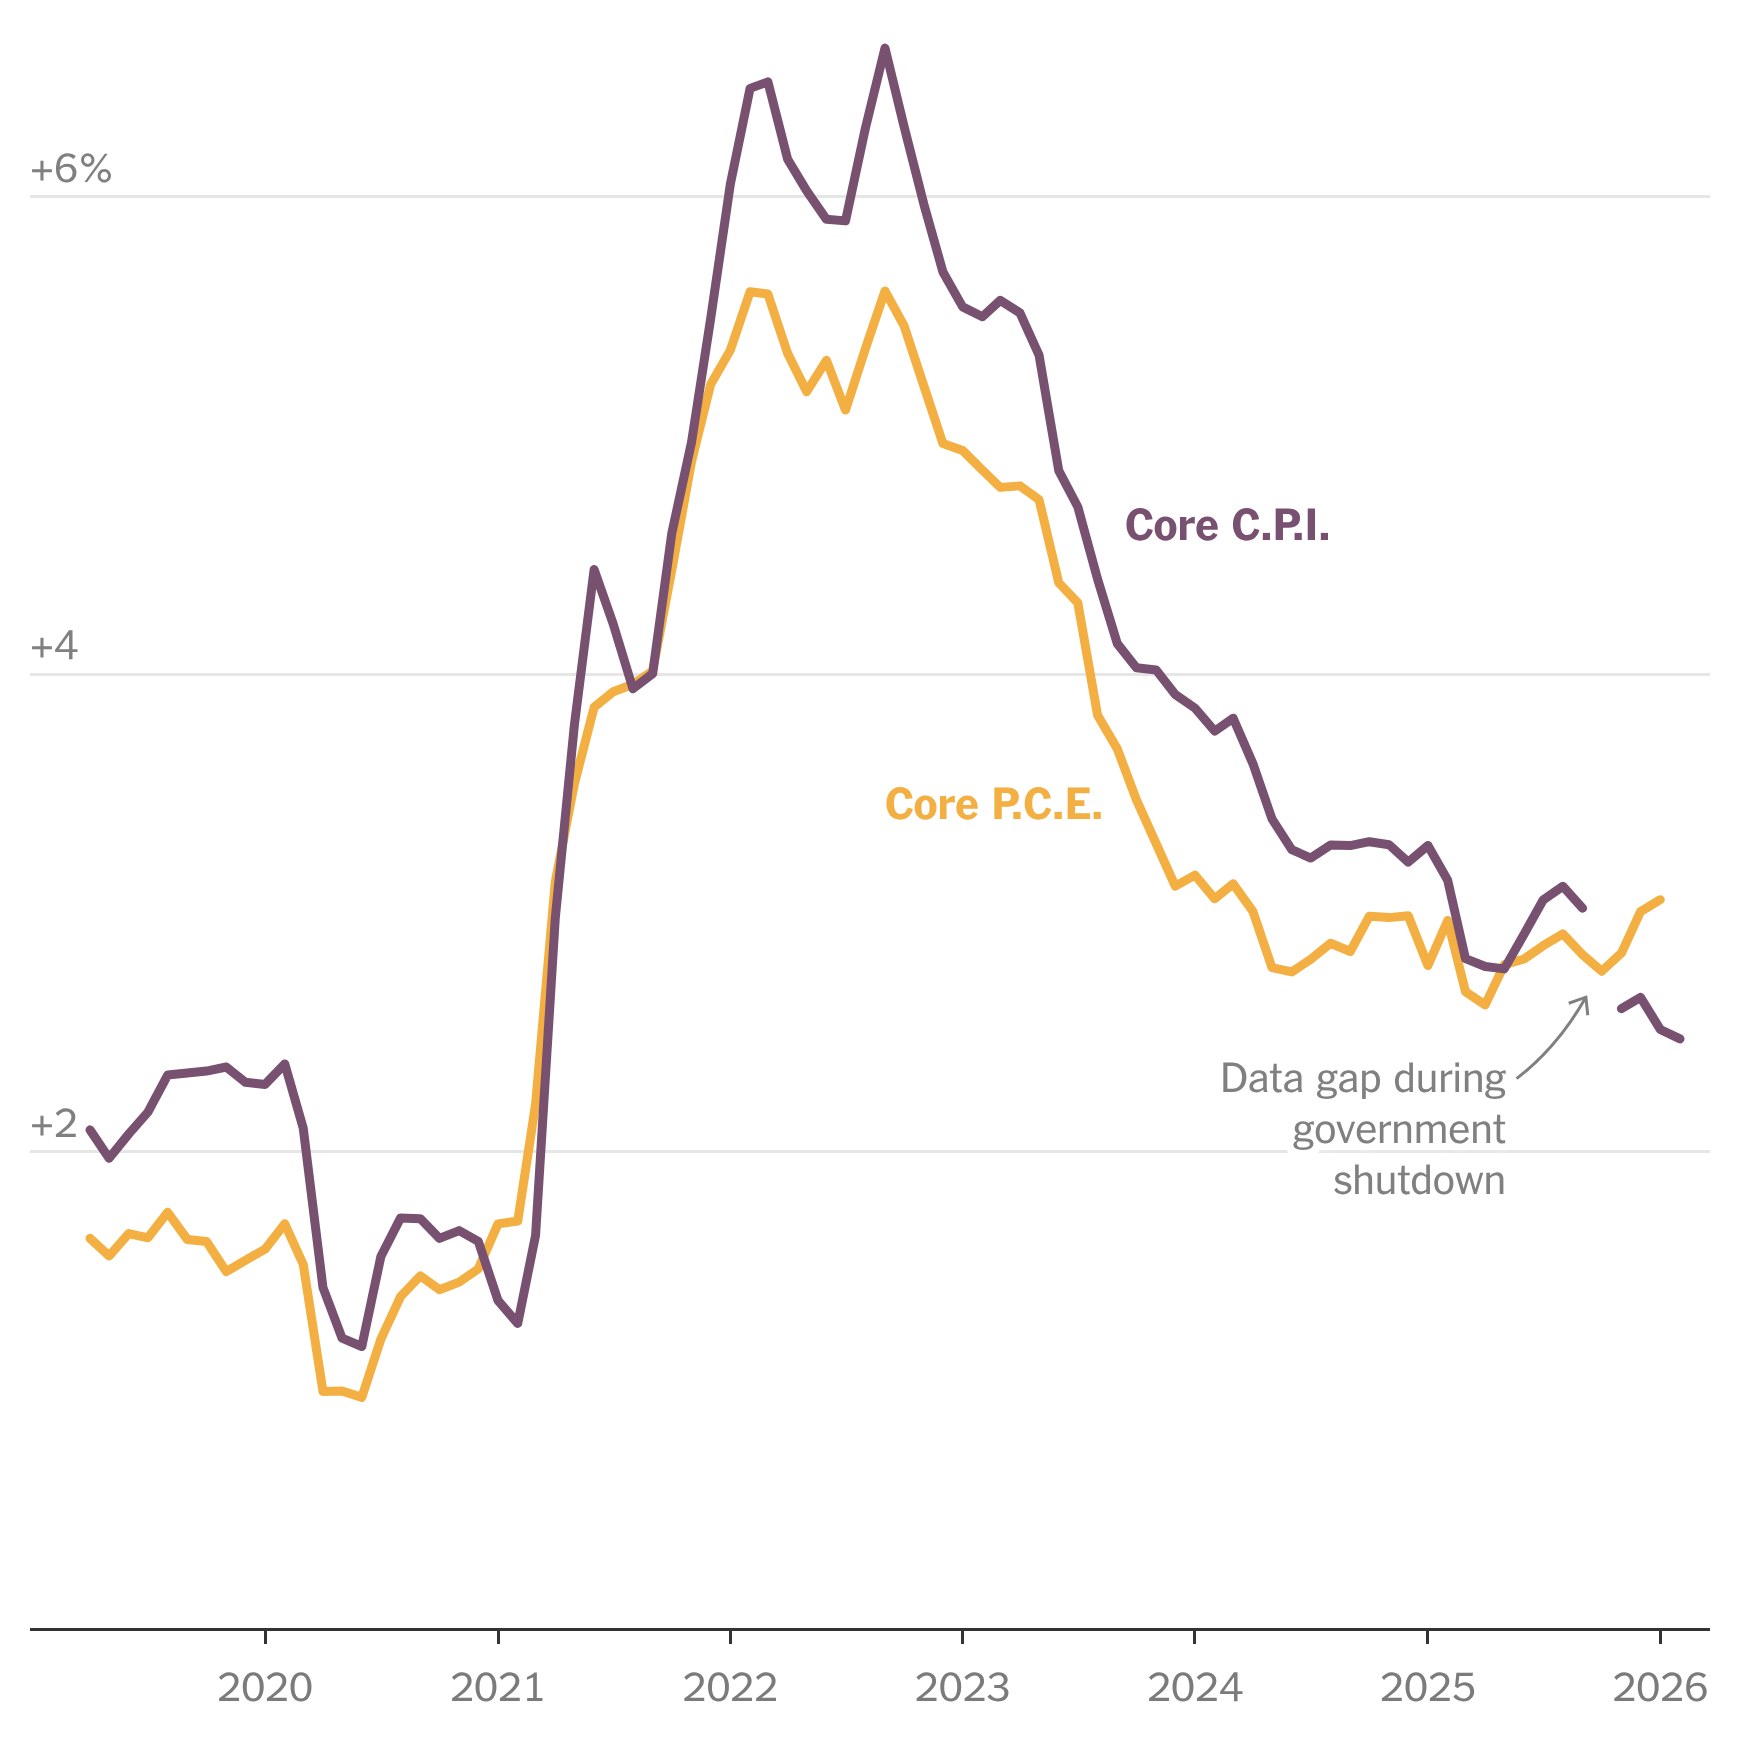
- Fed’s preferred core PCE rose 2.4% while core CPI climbed 3.0%, the widest gap since 2021.
- Shelter and healthcare weighting differences explain two-thirds of the split, Atlanta Fed analysis shows.
- Markets now price only a 35% chance of a May rate cut, down from 65% a month ago.
- Chair Powell told lawmakers the Fed needs ‘several consecutive months of convincing data’ before easing.
The central bank’s dual price gauges are telling opposite stories, paralyzing policy.
FEDERAL RESERVE—Washington — For monetary-policy makers, inflation is supposed to be a single, measurable dragon to slay. Yet the latest readings from Washington’s two flagship price indexes have veered so far apart that officials at the Federal Reserve openly concede they are flying blind. Core consumer-price inflation, tracked by the Bureau of Labor Statistics, is still printing above 3%, while the Commerce Department’s core personal-consumption-expenditures index — the Fed’s formal target — has drifted down to 2.4%. The 0.6-percentage-point spread, the widest since the post-pandemic reopening, leaves Chair Jerome Powell’s committee with no clear path on rates.
The divergence is not statistical noise. It reflects deep design differences: CPI captures what households pay out of pocket using a fixed basket updated every two years; PCE sweeps in all consumption, including employer-sponsored healthcare and Medicare outlays, and reweights categories monthly. When medical prices accelerate or rents soften, the gauges can move in opposite directions for quarters, exactly the dynamic now confounding officials who have held the federal-funds rate at 4.25-4.50% since January.
Markets reacted instantly. Fed-funds futures now imply the first 25-basis-point cut is more likely in September than May, a reversal that erased a December rally in tech shares and pushed the two-year Treasury yield back above 4%. Investors crave clarity; instead they have dueling data sets, each with its own constituency on the Federal Open Market Committee.
Why the CPI-PCE Gap Matters for Your Mortgage
If you are shopping for a home loan, the schism between CPI and PCE is not an academic footnote. Lenders price 30-year fixed mortgages off the ten-year Treasury yield, which in turn tracks the inflation gauge that traders believe the Fed will have to chase. When core CPI prints hot — as it did in February at 3.0% — bond desks assume the Fed will delay cuts, pushing yields higher even if core PCE is cooler.
Atlanta Fed president Raphael Bostic told reporters the gap has real economy consequences. “Markets overweight CPI because it comes out first and has higher visibility, so households end up paying an extra 15 to 20 basis points on mortgage rate quotes,” Bostic said following a speech in Savannah. On a $400,000 mortgage, that adds roughly $50 a month, or $18,000 over the life of the loan.
The wedge also distorts corporate planning. Costco CFO Richard Galanti told analysts on the retailer’s earnings call that when CPI headlines dominate, consumers assume broader inflation is worse than their personal experience, curbing discretionary purchases. “We see it in the data within 48 hours of the CPI release,” Galanti said. The phenomenon, confirmed by University of Michigan sentiment surveys, shows expectations can decouple from the Fed’s preferred PCE reality.
Inside the Fed, the split has hardened camps.
Governor Christopher Waller, long an inflation hawk, argued in a recent Minneapolis speech that CPI’s shelter component — which makes up 34% of the index versus 16% in PCE — is signaling stickier price pressures than officials acknowledged last year. Conversely, Chicago Fed chief Austan Goolsbee contends that PCE is the more comprehensive gauge and that CPI is overcounting rental inflation because of methodological lags. The debate is not new; what changed is that both indexes now sit on opposite sides of the Fed’s 2% goal, making the choice of yardstick decisive for policy.
Shelter, Health, and the Math Behind the Split
To understand why the indexes diverge, look no further than two spending categories: shelter and healthcare. The Bureau of Labor Statistics gives shelter a 34% weight in CPI, reflecting the share of household budgets devoted to rent and owners’ equivalent rent. The Commerce Department assigns only 16% to housing services in PCE, because the index captures non-cash imputations and third-party payments.
Healthcare flips the script. CPI counts only direct household outlays — insurance copays and prescription costs — giving medical care a 9% share. PCE includes Medicare, Medicaid, and employer premiums, pushing healthcare to 16%. When medical inflation accelerated to 5.1% earlier this year, PCE felt the spike while CPI barely budged.
Peterson Institute senior fellow Karen Dynan notes that the reweighting effect is magnified because PCE uses a Fisher-index formula that adjusts to substitution behavior. “If beef prices surge and shoppers shift to chicken, PCE lowers the effective weight on beef within the month; CPI waits two years,” Dynan explained. Over time, the substitution bias can shave 0.3-0.4 percentage points off annual inflation, enough to explain half the current gap.
Historical episodes show gaps above 0.5 points precede policy errors.
In 2002, a similar divergence preceded the Fed’s too-slow response to disinflation, while in 2011 the spread briefly hit 0.7 points, leading then-chair Ben Bernanke to downplay commodity-driven CPI spikes as “transitory” — a descriptor Powell revived in 2021 only to regret a year later. Today’s 0.6-point split sits right at the threshold where staff models start flashing amber, according to transcripts of the January FOMC session.
What Happens When the Fed Waits?
History offers a sobering lesson: when the Fed delays action amid conflicting signals, financial conditions tighten on their own. In 1995, Chair Alan Greenspan paused as CPI stayed above 3% while PCE drifted to 2%, and the bond market priced in higher real rates, slowing housing and capex without any additional Fed moves. The episode ended with the Fed cutting 75 basis points in the second half of the year.
Today’s analog is unfolding in real time. Since January, the average 30-year fixed mortgage rate has climbed from 6.6% to 7.1%, according to Freddie Mac’s weekly survey. Refinance applications are down 28% year-to-date, and the National Association of Home Builders’ index has fallen for three consecutive months. Fed staff estimate every 10-basis-point rise in mortgage rates trims home sales by 1%, implying a 5% drag if the trend persists.
Corporate credit is feeling the squeeze too. Bloomberg’s investment-grade bond index shows spreads over Treasuries have widened 18 basis points since February, adding roughly $500 million in annual interest expense for S&P 500 non-financial issuers, per Bank of America strategists. The self-inflicted tightening is precisely what Powell hoped to avoid by telegraphing patience, yet markets insist on pricing a hawkish path until both inflation metrics align.
International spillovers complicate the wait-and-see stance.
The European Central Bank targets CPI, not PCE, and euro-area HICP has re-accelerated to 2.8%. If the Fed stands still while the ECB resumes hikes, dollar depreciation could re-import inflation through higher import prices, keeping U.S. CPI elevated even as domestic demand cools. It’s the textbook definition of a policy stalemate, and it explains why Powell keeps repeating the need for “greater confidence” — code words for a unified inflation signal the Fed has yet to receive.
Could a New Index Bridge the Divide?
Frustrated by the dueling data, a bipartisan group of lawmakers has revived legislation directing the Fed to produce a single “unified price index” blending CPI timeliness with PCE scope. The bill, sponsored by Senators Bill Cassidy (R-La.) and Mark Warner (D-Va.), would fund a joint BLS-BEA task force to publish a hybrid gauge within two years. Similar proposals died in committee in 2018 and 2021, but the current 0.6-point gap has given the idea new urgency.
Fed governor Lisa Cook told the Senate Banking Committee she is “open to exploring methodological improvements,” yet cautioned that any new index would need to preserve the PCE’s ability to capture substitution effects. Markets read her remarks as a dovish tilt, interpreting official openness as implicit endorsement of the cooler PCE path.
Outside academics are skeptical. Harvard economist Alberto Cavallo co-authored a 2022 study showing that a unified index would have shaved only 0.2 percentage points off annual inflation during the 2021-22 spike, leaving more than half the current divergence unexplained. “The issue isn’t just basket weights; it’s measurement frequency and scope,” Cavallo said, noting that healthcare prices are collected quarterly in PCE but monthly in CPI, creating unavoidable lags.
Any transition risks market volatility similar to the 2003 adoption of chain-weighted GDP.
Fixed-income portfolio managers would need to rewrite mandates, inflation swaps referencing CPI would require repricing, and Treasury Inflation-Protected Securities (TIPS) coupons could become misaligned. The Richmond Fed estimates transition costs at $2.4 billion for dealers alone, a figure that has kept reform advocates at bay. Unless Congress funds the switch, the Fed is likely stuck navigating policy with the same split-screen dashboard that has defined its communications challenge since the 1990s.
Forward Guidance: When Will the Gap Close?
Fed staff projections submitted to the March FOMC show the CPI-PCE gap narrowing to 0.2 percentage points by year-end, but that forecast hinges on rent inflation decelerating to a 2.5% annual pace and healthcare prices re-entering their pre-pandemic 1.8% trend. Both assumptions look shaky: Zillow’s observed rent index is ticking up again, and pharmacy benefit managers warn that weight-loss drug demand is pushing employer plan costs higher.
Private forecasters are more cautious. Morgan Stanley economists expect the divergence to persist until the second quarter of 2027, forcing the Fed to keep the funds rate above 4% throughout this cycle. Their model assigns a 40% probability that CPI re-accelerates above 3.5% while PCE remains near 2.5%, a scenario that would intensify political pressure on Powell ahead of the 2026 midterms.
Options markets imply a 25% chance of a 50-basis-point inter-meeting cut if the gap closes quickly, a tail-event traders dub the “inflation convergence trade.” Until then, officials have signaled they will lean on communications rather than action, using speeches to nudge Treasury yields lower without actually moving the policy rate.
Investors should watch three upcoming releases.
The March CPI report due April 10 will update shelter weights for the first time since 2024; if the BLS incorporates new single-family rent data, the category’s index could fall 0.3 points, shaving 0.1 point off headline CPI. The April PCE release will include annual benchmark revisions that have historically shifted core PCE by up to 0.2 points. Finally, the May FOMC statement could add language distinguishing between the two metrics, a rhetorical shift that in 2012 presaged the 2013 taper. Until these milestones pass, the Fed’s mantra of patience will remain more than a talking point — it is the only policy lever officials feel safe pulling.
Frequently Asked Questions
Q: Why do CPI and PCE inflation numbers differ?
CPI tracks out-of-pocket spending using a fixed basket, while the PCE index captures all consumption, including third-party payments, and adjusts weights monthly. The PCE also gives healthcare a 16% share versus CPI’s 9%, so shifting medical prices can push the two indexes apart.
Q: Which inflation gauge does the Fed target?
The Federal Reserve targets the annual change in the Personal Consumption Expenditures Price Index, specifically the core PCE that excludes food and energy, aiming for a symmetric 2% objective over the medium term.
Q: What happens when CPI and PCE diverge?
Large divergences force policymakers to reconcile conflicting signals. If core CPI runs hot while core PCE cools, officials may delay rate moves until the gap narrows, fearing overtightening or reigniting inflation expectations.
