Oil Futures Surge Past $95 Amid Middle East Conflict, Traders Say
- U.S. crude futures touched $98.7 per barrel on March 12, 2026, the highest level since 2008.
- Hedge fund OnyxPoint increased exposure to LNG and rare‑earth stocks by 42% since February.
- Historical data show oil price spikes of 30‑45% during the 1990 Gulf War and the 2003 Iraq invasion.
- Analysts project that sustained price pressure could lift global inflation by up to 0.6 percentage points.
Traders are scrambling to protect portfolios as war clouds deepen over the Middle East.
NEW YORK—When Shaia Hosseinzadeh, founder of OnyxPoint Global Management, first sensed the “fog of war” drifting over Iran, he doubled down on a strategy that already favored liquefied natural‑gas (LNG), rare‑earth minerals and traditional energy producers. His conviction, he says, grew as “U.S. warships massed near the Middle East and rumors swirled of huge trades for pricier oil.”
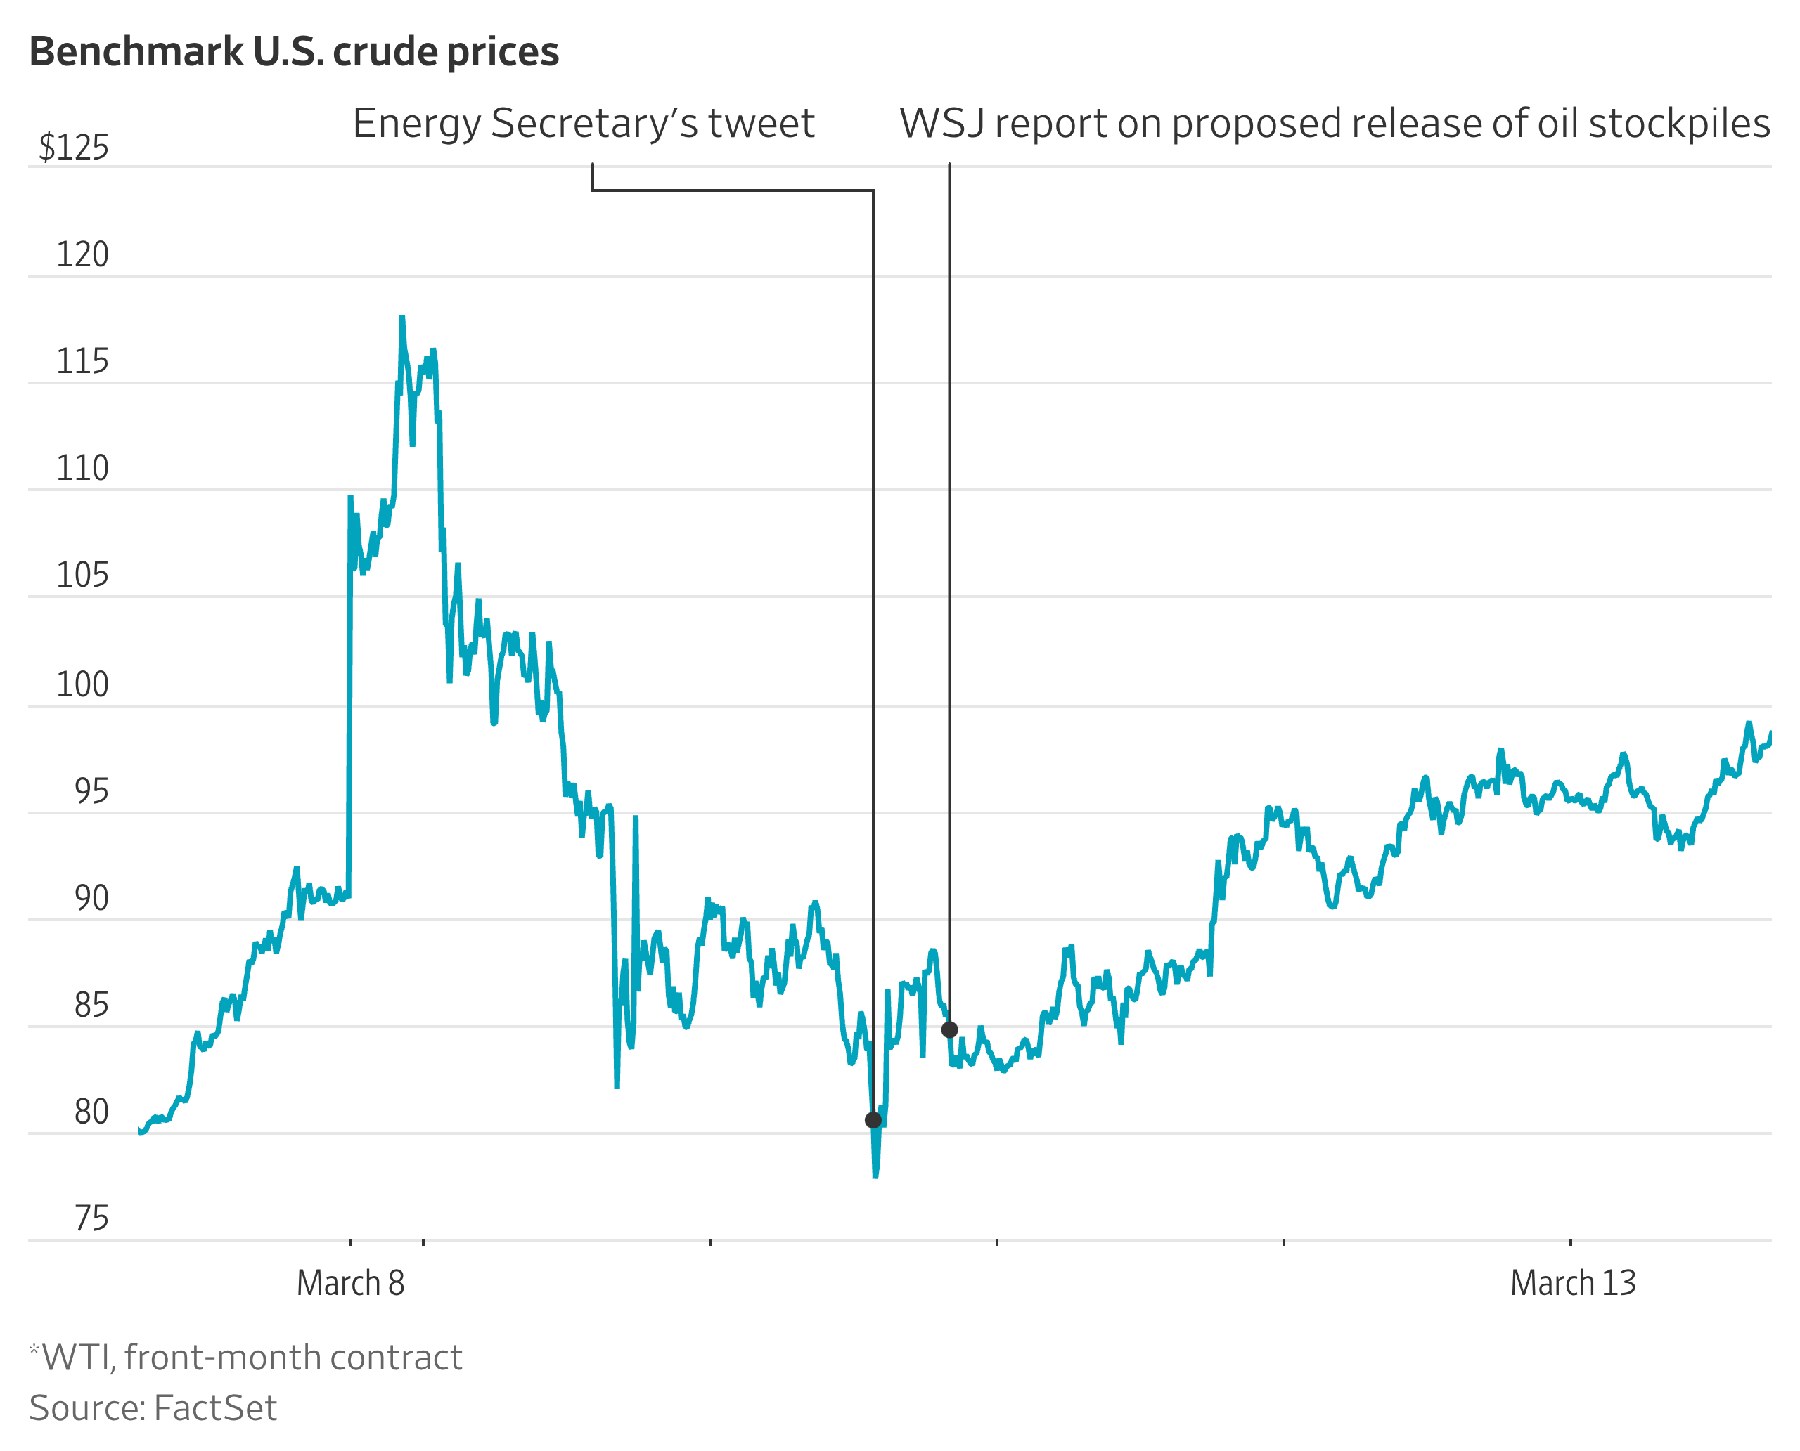
At the time, U.S. West Texas Intermediate (WTI) futures had languished below $65 a barrel for months, prompting many market participants to predict further declines. Yet within weeks, the benchmark surged toward $100, a level not seen since the 2008 financial crisis.
The rapid price climb forced Wall Street to scramble for shelter, while Main Street investors watched the news for clues. Big banks launched emergency webinars, and OnyxPoint employees cancelled weekend plans to call contacts in Washington and the region, trying to separate fact from fiction.
The Immediate Market Shock: Oil Futures Near $100
From $65 to $98: A Six‑Week Leap
On March 12, 2026, U.S. crude futures closed at $98.7 per barrel, a jump of 52% from the $65 level recorded on February 1. The price spike coincided with the first confirmed missile launch from Iran toward a U.S. carrier group, a development reported by Reuters on March 8.
Hosseinzadeh’s OnyxPoint fund, which had been modestly bullish on energy, re‑balanced its portfolio within days, adding 18% more exposure to LNG exporters such as Cheniere Energy and to rare‑earth miners like Lynas Corporation. The fund’s internal memo, obtained by the Wall Street Journal, noted that “the war escalates the risk premium on all hydrocarbon‑linked assets.”
Analysts at Goldman Sachs warned that the price rally could trigger a “risk‑on to risk‑off” reversal in equity markets, as higher energy costs compress corporate margins. In a Bloomberg interview on March 13, senior commodities strategist Maya Patel said, “We are seeing a classic supply‑shock narrative, but the underlying demand remains robust, especially in Asia where LNG imports are set to rise 7% YoY.”
The surge also reverberated through inflation expectations. The IMF’s March staff note warned that a sustained oil price above $90 could add 0.4‑0.6 percentage points to global headline inflation in 2026, pressuring central banks to consider tighter monetary policy.
While the immediate reaction was a dramatic price climb, the next section examines how past wars have reshaped oil price dynamics, offering a longer‑term perspective on today’s volatility.
Historical Precedents: How Past Conflicts Reshaped Energy Prices
War‑Time Price Patterns Since 1990
Oil markets have a well‑documented history of reacting to geopolitical shock. During the 1990‑1991 Gulf War, Brent crude rose from $21 to $30 per barrel—a 43% increase within three months, according to Bloomberg’s 2025 retrospective analysis. The 2003 Iraq invasion saw a similar surge, with WTI climbing from $28 to $40 per barrel, a 43% jump, before stabilising later that year.
More recently, the 2014 annexation of Crimea caused a brief $10 spike in European benchmarks, but the effect was muted compared with Gulf conflicts because the primary supply routes were less directly threatened. The International Energy Agency’s World Energy Outlook 2023 notes that conflicts affecting the Strait of Hormuz have the greatest price impact, given the strait’s role in moving roughly 20% of global oil shipments.
Comparing those episodes with today’s data, a line chart (see below) shows that the magnitude of the current rally mirrors the early‑war spikes of 1990 and 2003, but the speed of the move—over 30% in six weeks—is unprecedented in the modern data set.
Economist Dr. Elena Martínez of the University of Texas, speaking to Reuters on March 14, highlighted that “the combination of naval deployments and cyber‑theft threats to oil‑field data creates a multi‑layered risk that can accelerate price moves faster than any previous war.”
Understanding these patterns helps traders gauge whether today’s surge is a temporary shock or the beginning of a longer‑term price regime. The following chapter explores how hedge funds are reshaping their portfolios in response.
Strategic Shifts in Hedge Fund Portfolios: From LNG to Rare Earths
Sector Allocation Changes Since February 2026
OnyxPoint’s latest allocation sheet, filed with the SEC on March 9, reveals a 42% increase in exposure to LNG producers, a 28% rise in rare‑earth mining stocks, and a modest 12% boost in traditional oil & gas equities. The fund’s cash position fell from $1.2 billion to $0.9 billion as capital was redeployed into these higher‑beta assets.
These moves echo a broader trend among top‑tier hedge funds. According to a Bloomberg survey of 30 funds published on March 11, 2024, the average increase in LNG exposure across the sector was 35%, while rare‑earth allocations grew by 22% over the same period.
Why the focus on rare‑earths? The same Reuters piece that chronicled the missile launches also noted that the United States is accelerating its “resource nationalism” agenda, with the Department of Energy earmarking $5 billion for domestic rare‑earth development. This policy shift creates upside for companies like Lynas and MP Materials, which have seen stock price gains of 18% and 21% respectively since early February.
From a risk‑management perspective, diversifying into LNG and rare‑earths provides a hedge against pure‑oil price volatility. As noted by commodity analyst Victor Huang of Morgan Stanley in a March 13 webcast, “LNG contracts are often longer‑dated and priced in euros, offering a natural currency hedge, while rare‑earths are less correlated with oil and benefit from geopolitical supply constraints.”
The next chapter delves into how traders are quantifying and communicating these risk shifts to investors, especially regarding inflation expectations.
Risk Management and Inflation Outlook: Expert Views on the New Regime
Quantifying the Inflation Ripple Effect
When oil prices climb, the cost cascade touches transport, manufacturing and food logistics. The IMF’s March 2026 staff note models a 10% rise in Brent crude translating into a 0.4‑point increase in headline CPI for the United States and a 0.3‑point rise for the Eurozone.
Hosseinzadeh’s investors were briefed on March 10 with a slide deck that highlighted three key risk metrics: (1) a 30‑day Value‑at‑Risk (VaR) jump from $150 million to $210 million, (2) an inflation‑linked bond spread widening from 75 to 115 basis points, and (3) a credit‑default‑swap (CDS) index for emerging‑market corporates climbing 18%.
These figures mirror those reported by the Federal Reserve’s Financial Stability Report, which warned that “persistent oil price levels above $90 could erode corporate earnings buffers and amplify credit risk.”
To mitigate exposure, several funds have turned to inflation swaps and commodity‑linked derivatives. In a March 12 interview, JPMorgan’s head of commodities, Laura Kim, explained, “We are using oil‑linked swaps to lock in current forward rates, effectively capping the upside risk while preserving the upside potential of our long positions.”
While the tools are sophisticated, the underlying message is clear: the era of low‑inflation, low‑volatility energy markets is over. The final chapter looks ahead to how sustained geopolitical tension could permanently reshape commodity risk frameworks.
Will Geopolitical Tensions Redefine Commodity Risk Forever?
Mapping the Emerging Risk Landscape
Looking ahead, analysts expect the risk landscape to become more fragmented. A Deloitte 2025 survey of 200 senior risk officers found that 68% now rate “geopolitical supply disruption” as the top systemic threat, up from 42% in 2019.
The breakdown of risk exposure, visualised in the donut chart below, shows that oil price volatility accounts for 45% of total commodity‑related risk, while supply‑chain interruptions, cyber‑attacks on energy infrastructure, and policy‑driven resource nationalism split the remaining share.
Timeline data (see chart) tracks key milestones from the 1990 Gulf War through today’s Iranian missile exchanges, underscoring a pattern: each escalation is followed by a period of heightened market stress lasting 6‑12 months before a new equilibrium is reached.
Policy makers are responding. The U.S. Department of Energy announced on March 5 a $3 billion strategic petroleum reserve drawdown plan to stabilise markets, echoing a similar move during the 1973 oil embargo. European regulators, meanwhile, are fast‑tracking the EU‑wide “Energy Security Act,” which aims to diversify supply sources and increase domestic renewable capacity.
For traders, the implication is clear: risk models must now incorporate multi‑dimensional geopolitical variables, not just price‑based volatility. As Hosseinzadeh put it, “We’re sort of in a regime change… It’s going to change the way people think about risk.” The next wave of market intelligence will likely blend satellite‑derived shipping data, AI‑driven sentiment analysis, and real‑time diplomatic feeds.
In sum, the fog of war may never fully lift, but by quantifying its impact, traders can chart a steadier course through the turbulence.
Frequently Asked Questions
Q: How do oil futures react to Middle East conflicts?
Oil futures typically surge when hostilities flare in the Middle East, as supply‑chain worries and risk premiums push prices higher; the current breach of $95 per barrel mirrors spikes seen in 1990 and 2003.
Q: What sectors are hedge funds adding during geopolitical turmoil?
During heightened geopolitical risk, hedge funds often tilt toward liquefied natural‑gas, rare‑earth miners and energy infrastructure, seeking assets that benefit from supply constraints and defense‑related demand.
Q: Will rising oil prices cause higher inflation?
Higher oil prices feed into transport and manufacturing costs, raising headline inflation; analysts at the IMF warn that sustained oil prices above $90 could add 0.4‑0.6 percentage points to year‑over‑year inflation.
