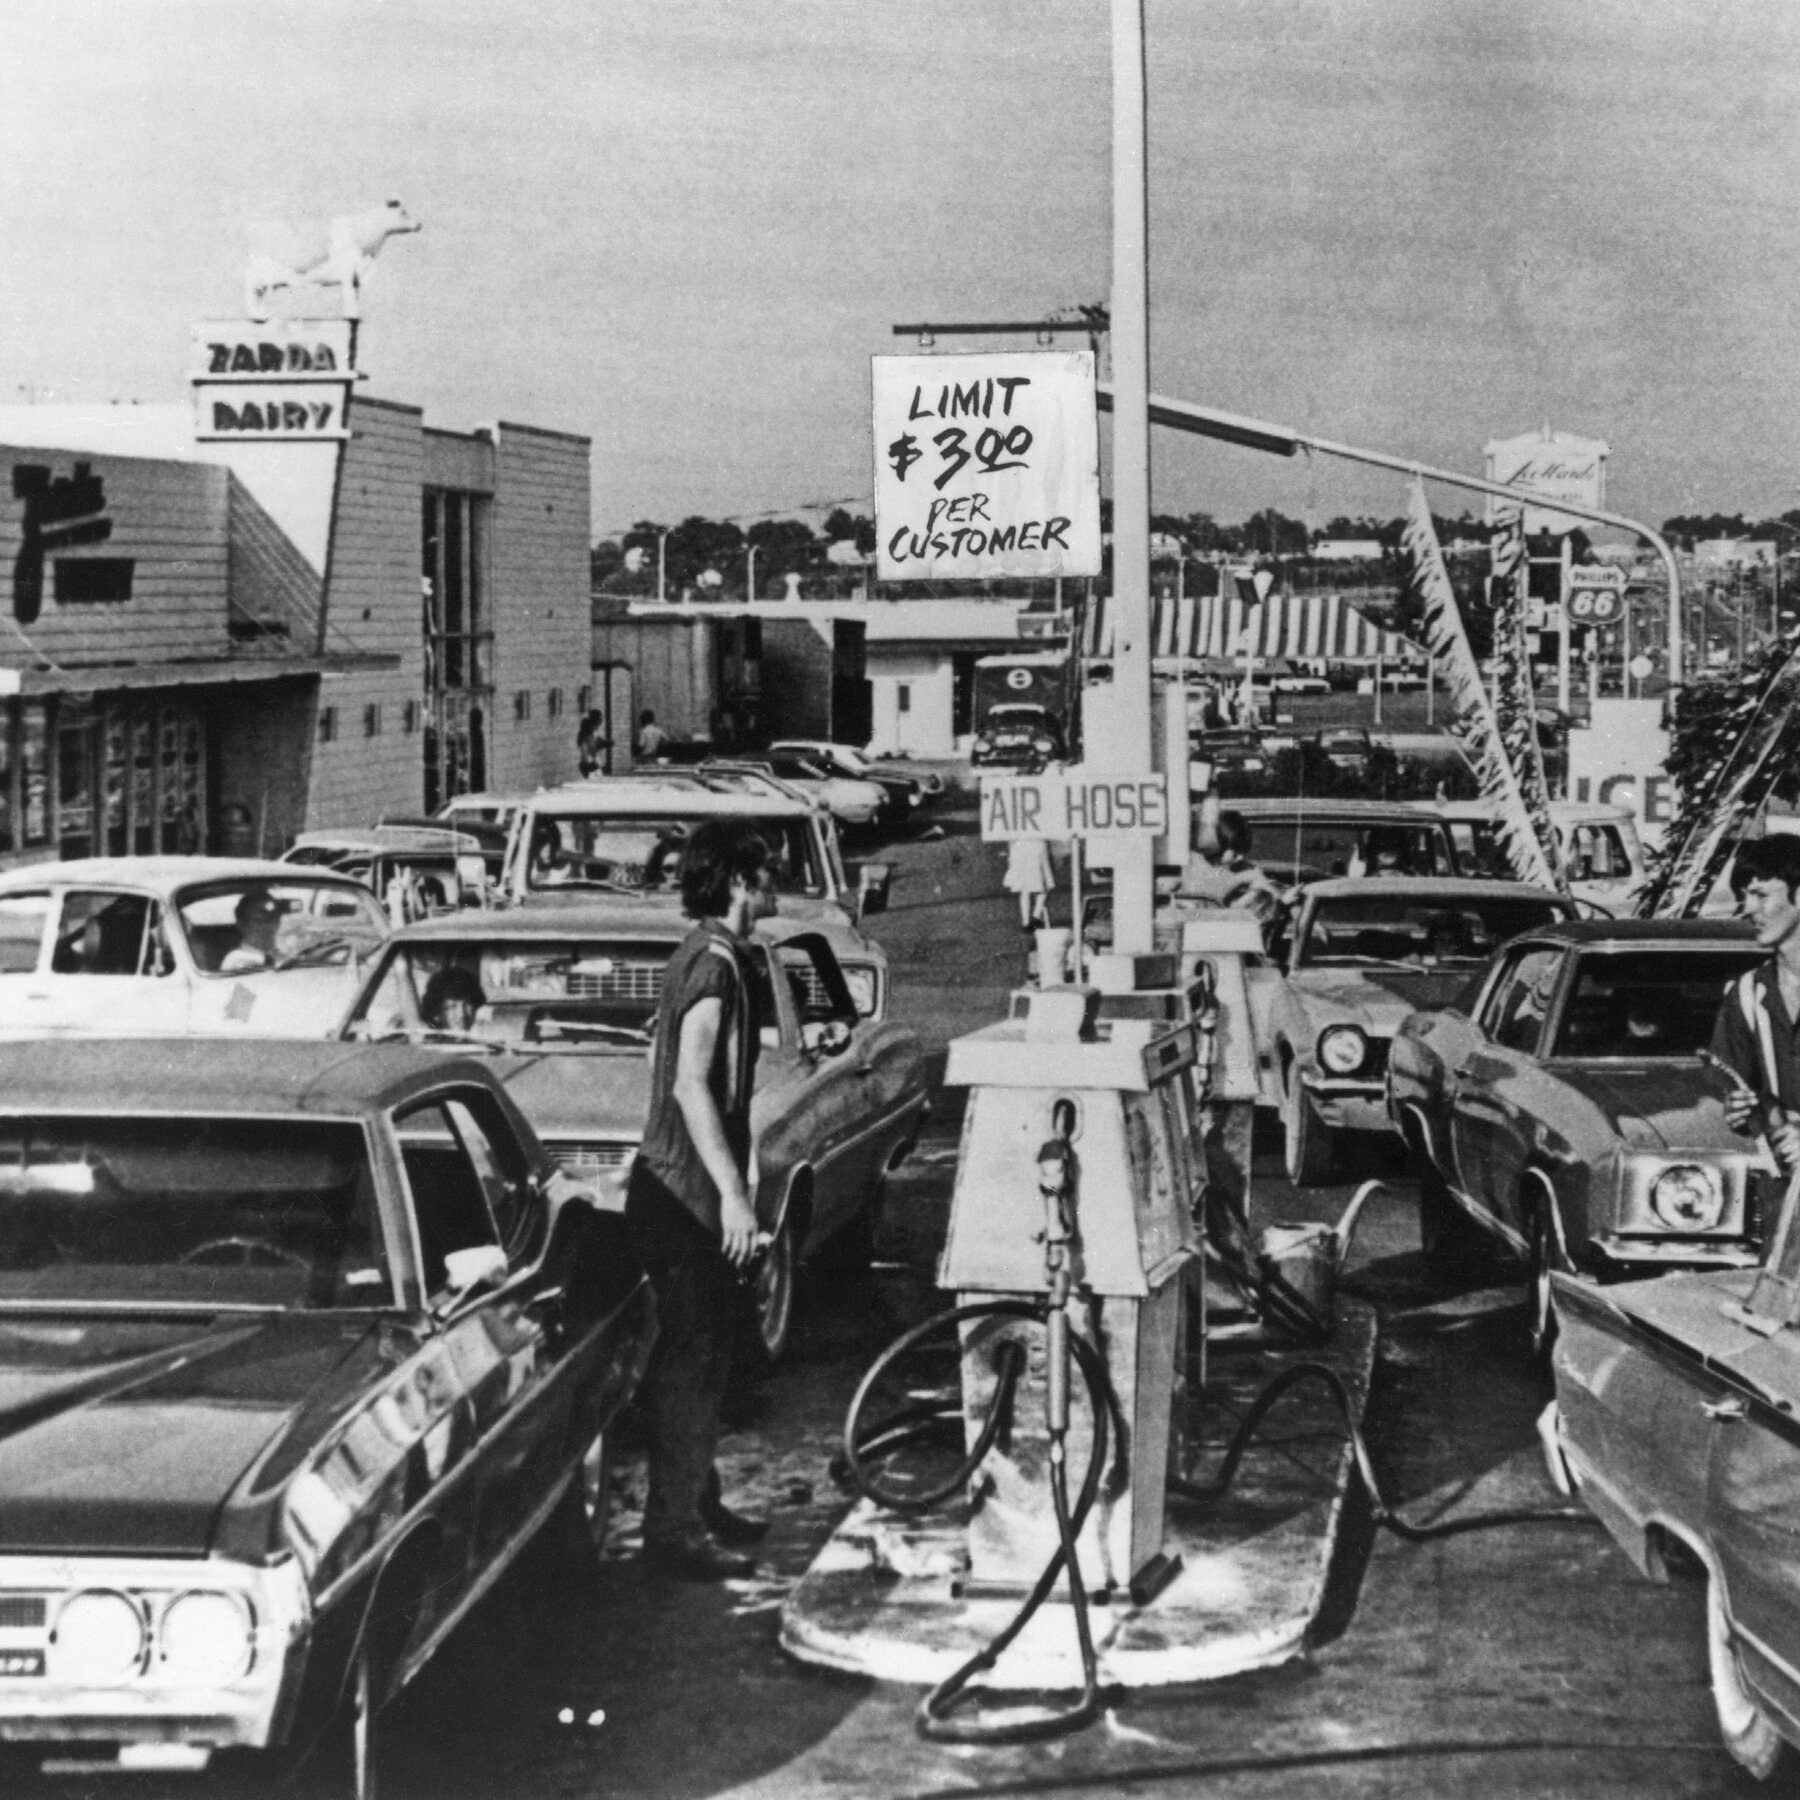
1973 Oil Embargo Quadrupled Prices; Iran War Risk Puts 2 mb/d Flow in Doubt
- 1973 Arab embargo sent U.S. retail gasoline from 38 ¢ to 55 ¢ a gallon within four months.
- 1979 Iranian revolution removed 2.5 mb/d from market, pushing Brent to $39/barrel.
- Today’s Strait of Hormuz transit carries 21 % of global seaborne oil, equal to 17 mb/d.
- IEA warns spare OPEC capacity has fallen below 4 % of demand, the thinnest buffer since 2003.
- Analysts at Goldman flag $150/bbl Brent if conflict disrupts even one-third of Hormuz flows.
Gas lines and stagflation scarred a generation; policymakers fear a rerun.
IRAN CONFLICT—In October 1973, Dutch service stations turned off lights to save fuel while Tokyo commuters abandoned grid-locked subways. Within a year, crude had quadrupled, Western inflation hit double digits and the financial world jettisoned 25 years of fixed exchange rates. Half a century later, tanker-tracker data show 17 million barrels of crude and condensate moving daily through the Strait of Hormuz—one fifth of all seaborne oil trade.
Energy economists at Goldman Sachs now model a 30 % probability that military escalation around Iran could knock out 2 million barrels per day (mb/d) of supply. Their base case leaves Brent at $94/bbl; the disruption case lifts it to $150. “The market has no safety valve,” warns Jeff Currie, the bank’s head of commodities research. “Spare capacity is effectively gone.”
The parallel with the 1970s is not academic. Then, a regional war turned energy into an economic weapon, re-wired capital flows and ended an era of low inflation. Today, with OPEC’s spare cushion below 3 mb/d—its lowest since 2003—diplomats and traders are dusting off contingency plans last opened during the Gulf War of 1990.
How the 1973 Embargo Flipped the Global Energy Order
On 16 October 1973, OPEC ministers meeting in Kuwait City unilaterally raised the posted price of Arabian Light from $3.01 to $5.12 per barrel. Two days later, Arab exporters declared a 5 % monthly cut in shipments to the United States and any nation deemed to be supporting Israel. By January 1974, Brent crude traded at $11.65—quadrupling in 90 days.
From abundance to scarcity overnight
The United States, which had produced 11 mb/d in 1970, could no longer cover domestic demand. Federal price controls masked the pain for months, but motorists felt it in queues that snaked around city blocks. The National Bureau of Economic Research calculates that U.S. gasoline consumption fell 6.8 % in 1974, the steepest annual drop recorded before the 2008 financial crisis.
Europe, reliant on imports for 80 % of oil, scrambled for barrels. West Germany introduced car-free Sundays; France rationed heating oil; Britain imposed a 50 mph speed limit. “The psychological shock was bigger than the physical shortage,” says Professor Paul Stevens, energy historian at Chatham House. “Policy makers realized they were no longer in control.”
The embargo’s after-shocks rippled through finance. Petrodollars piled up in Gulf banks; those surpluses were recycled as Eurodollar deposits, breaking the Bretton Woods fixed-rate regime and ushering in floating currencies. IMF data show Middle-East current-account surpluses jumping from $7 billion in 1972 to $68 billion in 1974—equal to 2.1 % of global GDP.
By 1975, U.S. CPI inflation peaked at 12.3 %; unemployment hit 9 % two years later. The misery index—unemployment plus inflation—reached 19 %, a level not seen again until 2022’s post-COVID spike. The episode embedded the word “stagflation” into economic vocabulary and convinced Washington to create the Strategic Petroleum Reserve (SPR), now the world’s largest emergency stockpile at 713 million barrels.
Forward look: The embargo demonstrated that energy security is inseparable from monetary stability—a lesson central banks are re-learning as geopolitical risk once again converges with thin supply buffers.
Why 1979 Was Different—and Worse—for Inflation
If 1973 was a demand-side jolt, the 1979 crisis was pure supply destruction. The Iranian revolution took 2.5 mb/d offline—roughly 5 % of free-world supply—at a time when OECD inventories covered only 65 days of demand, down from 95 days in 1973.
Price controls amplified panic
President Carter phased out U.S. price controls between June 1979 and October 1981. During the transition, domestic crude chased the world price from $15 to $39 per barrel. Daniel Yergin, author of “The Prize,” notes that controls had kept U.S. oil 30 % below market, so their removal felt like a second shock inside 12 months.
Inflation responded violently. U.S. CPI jumped from 9 % in December 1978 to 14.8 % in March 1980. Federal Reserve Chairman Paul Volcker, appointed in August 1979, hiked the fed-funds target to 20 % by June 1981, triggering back-to-back recessions but ultimately breaking price psychology.
Europe fared no better. The Bank of England raised base rates to 17 %; Sweden’s central bank touched 10 %. Worldwide, the IMF estimates the oil bill rose from $180 billion in 1978 to $340 billion in 1980—an extra 2 % of global GDP transferred to producers in just 24 months.
Automakers retooled overnight. U.S. car sales fell from 12.9 million in 1978 to 10.9 million in 1980; the share of imports rose above 25 % for the first time. Japanese makers with small engines gained permanent market share; Detroit’s Big Three never fully recovered.
Forward look: The episode proved that monetary policy, not energy policy alone, determines whether an oil spike becomes entrenched inflation—a reality today’s central banks monitor via five-year breakeven rates and wage-price spirals.
What a Hormuz Closure Would Mean for Today’s Market
The Strait of Hormuz is 21 miles wide at its narrowest point; inbound and outbound shipping lanes are each two miles wide. Roughly 17 million barrels of crude, condensate and refined products pass through daily, according to tanker-tracking firm Vortexa. A single VLCC (Very Large Crude Carrier) carries 2 million barrels—equal to Italy’s daily imports.
Spare capacity is already razor-thin
OPEC’s own data show effective spare capacity at 3.9 mb/d in the first quarter of 2026, down from 6.7 mb/d in 2019. Saudi Arabia holds 3 mb/d, UAE 0.9 mb/d and Kuwait 0.3 mb/d; the rest is in Iraq and Iran—both exposed to regional conflict. “Any disruption above 1 mb/d leaves us in uncharted territory,” says Amrita Sen of Energy Aspects.
Unlike the 1970s, today’s market has floating storage. There are roughly 100 million barrels of crude on tankers waiting for customers, but most are within Asia and would take 20–25 days to reach Europe via the Cape of Good Hope—adding $3.50/bbl in freight.
Strategic reserves could cushion a short shock. OECD government stocks stood at 1.5 billion barrels in February 2026, covering 65 days of forward demand. The U.S. SPR can release up to 4.4 mb/d for 90 days under the International Energy Program, but Congress has mandated sales to fund deficit reduction, lowering the stockpile to its lowest level since 1984.
China, the world’s largest importer, has built a 900 million barrel reserve—equal to 80 days of net imports—but Beijing has never disclosed draw-down rates. Analysts at S&P Global estimate China could release 1 mb/d for six months without breaching strategic minimums.
Forward look: A Hormuz closure would trigger the largest coordinated SPR release in history, yet prices could still spike above $120/bbl within weeks, according to Oxford Economics modelling.
Can Central Banks Stop Oil Inflation Without Crushing Growth?
Oil shocks transmit to CPI through two channels: direct energy prices and second-round effects on transport, food and services. Federal Reserve Bank of San Francisco research shows a $10 increase in Brent adds 0.3 percentage points to U.S. headline inflation within 12 months, assuming no passthrough to core.
But core inflation is stickier today
Labour markets are tighter than in 1979: OECD unemployment is 5 % versus 7 % then, and wage growth in the euro area is running at 4.5 %—double the 2010-19 average. “Energy shocks now compete with wage-price spirals,” says Isabel Schnabel, ECB Executive Board member.
Central banks therefore face an asymmetric trade-off. If they hike too aggressively, they risk engineering a recession when household balance sheets are already squeezed by prior tightening. If they accommodate, expectations could de-anchor. Five-year breakeven rates in the U.S. have climbed from 2.1 % in January to 2.6 % in March 2026.
Energy intensity has fallen 60 % since 1973, but debt has risen. Global debt-to-GDP hit 331 % in 2025, versus 120 % in 1979. Higher rates therefore transmit more forcefully to housing, leveraged corporates and emerging markets. IMF modelling shows that a 200 bp rate rise today cuts output twice as much as in 1979.
Forward look: Central banks are likely to tolerate a temporary inflation overshoot, relying on forward guidance rather than Volcker-style shock therapy—raising the risk that oil-driven inflation becomes entrenched if the conflict drags into 2027.
Is the World Economy Better Prepared Than in 1973?
Today’s economy is less oil-intensive: the world uses 0.55 barrels of oil per $1,000 of GDP versus 1.4 barrels in 1973, thanks to efficiency and the shift to services. Renewables supply 30 % of global electricity, up from 6 % in 1973, and electric vehicles displaced an estimated 0.6 mb/d of oil demand in 2025.
Yet vulnerabilities have shifted, not vanished
Natural gas now mirrors oil’s role in 1973; Europe still imports 90 % of its gas, mostly via pipelines that cross geopolitical fault lines. Petrochemicals—plastics, fertilizers, specialty chemicals—are 100 % oil-derived and embedded in every supply chain.
Finance is also more interconnected. In 1973, daily foreign-exchange turnover was $15 billion; today it exceeds $7 trillion, according to BIS data. Algorithmic trading can amplify oil-price volatility into broader risk-off moves within seconds. During the 14 September 2022 attack on Saudi Aramco facilities, Brent jumped 20 % in intraday trading before settling 10 % higher—moves magnified by thin liquidity.
Strategic coordination is stronger. The IEA requires members to hold 90 days of net imports; in 1973, no such obligation existed. Real-time satellite data allow governments to track tankers and reroute cargoes faster than the months-long lag in 1973.
Forward look: Lower oil intensity buys time, but a prolonged Hormuz closure would still tip the global economy into recession, shaving 1.5 percentage points off OECD growth in 2027, Oxford Economics estimates.
Frequently Asked Questions
Q: How high did oil prices climb in the 1970s shocks?
Arab exporters embargoed the West in Oct 1973, sending Brent from $2.90 to $11.65/bbl by Jan 1974—a 300 % jump that persisted for five years and helped push U.S. CPI above 12 %.
Q: Could today’s market absorb an Iran-linked supply cut?
With global spare capacity near 3 mb/d, a 2 mb/d loss from the Strait of Hormuz would leave less than 1 mb/d cushion—far below the 6 mb/d buffer that cushioned the 1979 shock.
Q: Why did the 1970s oil shock alter global finance?
Petrodollar recycling created huge surpluses in Gulf banks; those funds flowed into Eurodollar markets, broke the Bretton Woods fixed-rate regime and fuelled the first wave of emerging-market debt crises.
Q: Is the world economy more resilient now?
Yes—oil intensity (barrels per $1 k of GDP) has fallen 60 % since 1973, but debt-to-GDP is twice as high, so an inflation spike could trigger faster monetary tightening and financial stress.
