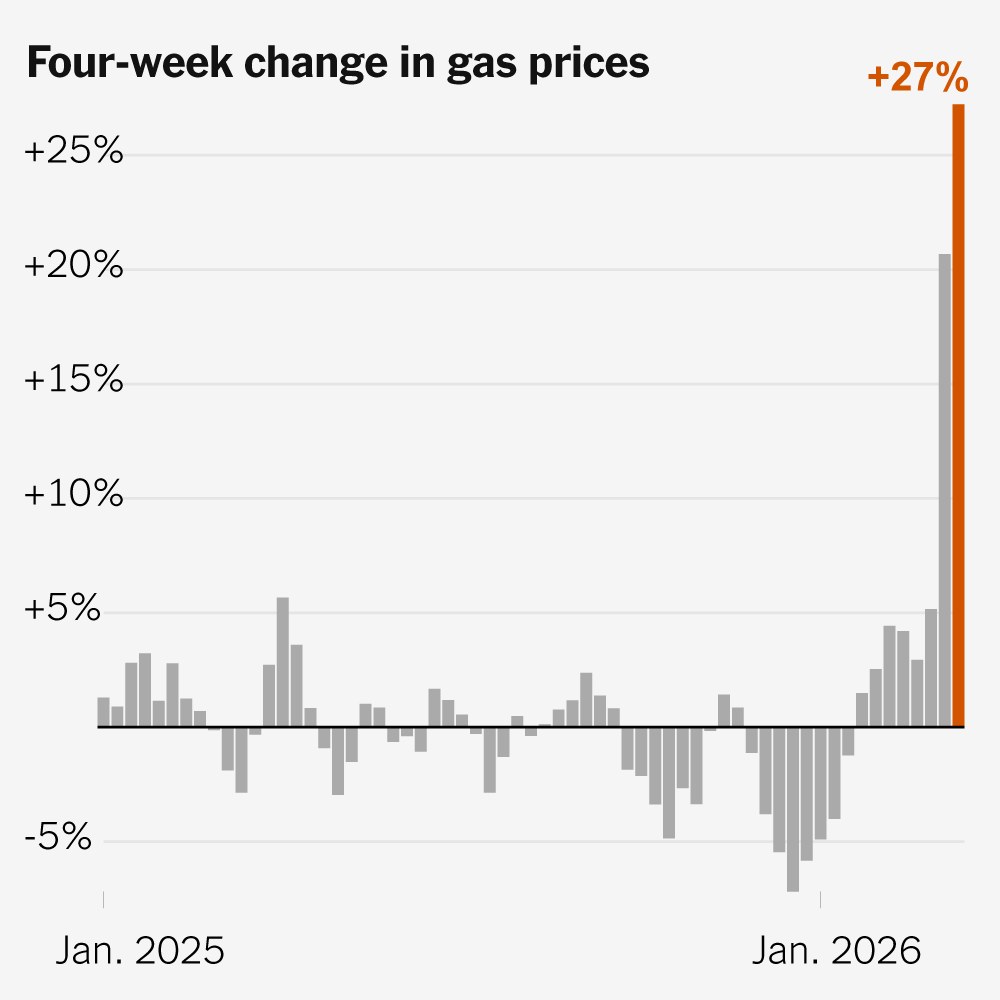
Iran War Drives 27% Gas-Price Surge, Second-Steepest Since 1990
- National average leaps from $2.90 to $3.70 a gallon in four weeks, the fastest pace since Hurricane Katrina.
- New Mexico, Arizona and Colorado each add more than a dollar per gallon, AAA data show.
- Crude supply disruption in the Strait of Hormuz offsets 30 million-barrel reserve release.
- Typical truck owner now pays $219 a month to drive 1,000 miles, up $47 in under 30 days.
Strait of Hormuz chokepoint turns regional conflict into immediate pain for U.S. motorists.
IRAN WAR—Within a month of Iran-linked hostilities closing the world’s most critical oil shipping lane, American motorists are living through the second-largest four-week gasoline price surge on record. Energy Information Administration figures show regular retail gasoline rose 27 percent between mid-February and mid-March, eclipsed only by the 30 percent spike that followed Hurricane Katrina in 2005.
The speed of the increase—almost a full dollar in 28 days—has already erased the modest price relief drivers enjoyed earlier this winter and rekindled memories of the volatility that followed Russia’s 2022 invasion of Ukraine. This time, however, the disruption is concentrated in the Persian Gulf, where roughly one-fifth of global seaborne crude typically transits the Strait of Hormuz.
Unlike previous shocks that unfolded over months, the current rally is compressing years of pain into weeks, leaving households little time to adjust budgets or commuting habits. “We are witnessing demand destruction in real time,” said Tom Kloza, global head of energy analysis at OPIS, a remark that underscores how quickly affordability constraints are reshaping travel patterns.
A Dollar in Four Weeks: How the Numbers Stack Up
The arithmetic is brutal: on February 16 the national average stood at $2.90 a gallon; by March 16 it had reached $3.70, according to weekly EIA surveys of 800 retail stations. That 80-cent jump equals a 27 percent gain, outstripping the 24 percent surge recorded after Ukraine was invaded in 2022 and the 21 percent increases seen during the 2009 post-recession oil rally and the 1999 OPEC production cuts.
Only one event in modern history has produced a steeper four-week trajectory—Hurricane Katrina on September 6, 2005, when damaged refineries and pipelines lifted prices 30 percent. Claire Poole, spokesperson for AAA, notes that today’s rally is remarkable because it is unfolding without a physical shortage of U.S. refining capacity. “The market is pricing in a perceived future deficit rather than reacting to actual lost barrels at home,” she explained.
Translating the increase to household budgets, a 1,000-mile monthly driver in an average 25-mpg vehicle now spends $149 instead of $117—an extra $384 annually if prices persist. Drivers of 17-mpg pickups absorb a $564 yearly hit, while even high-efficiency hybrids see monthly fuel bills rise from $56 to $72. The asymmetry is stark: lower-income families devote 9 percent of after-tax income to gasoline, compared with 3 percent for the top quintile, amplifying the inflationary sting.
Crude futures tell part of the story. Brent jumped from $76 to $97 a barrel in the same window, a $21 gain that filtered almost one-for-one into wholesale gasoline. Yet refiners’ margins have widened as well, climbing from 42 cents to 58 cents a gallon, the EIA reports, suggesting both feedstock and processing costs are inflating the retail number.
State-by-State Shock Map
No region escaped. AAA data for March 16 show every state adding at least 50 cents, with Rocky Mountain states hit hardest. New Mexico leapt $1.18 to $3.79, Arizona $1.17 to $4.33 and Colorado $1.06 to $3.82. California, already the nation’s priciest market, touched $5.53, up 94 cents. The geographic pattern reflects pipeline delivery constraints and higher regional taxes, but also the psychological premium traders assign to potential supply rerouting if Gulf exports falter.
Looking forward, futures curves suggest another 15 to 20 cents upside risk if Hormuz traffic remains disrupted into summer driving season. “We’re one drone strike away from $4.00 gasoline nationally,” Kloza cautioned, a scenario that would push the cumulative four-week gain past Katrina’s record.
Strait of Hormuz: Why Geography Amplifies Fear
The Strait of Hormuz is barely 21 nautical miles wide at its narrowest point, yet roughly 21 million barrels of crude, condensate and refined products transit the channel daily, according to the International Energy Agency. When Iran’s Revolutionary Guard threatened tanker traffic in early March, insurers immediately slapped war-risk premiums of $400,000 per voyage on Very Large Crude Carriers, effectively adding $2.50 a barrel to delivered costs in Asia.
U.S. motorists feel the repercussion because global crude prices set the baseline for domestic refiners. With European buyers scrambling for North Sea and West African grades, Brent—the waterborne benchmark—surged faster than land-locked West Texas Intermediate. The spread between Brent and WTI widened from $2 to $7, a differential that historically predicts how much East-Coast gasoline will cost.
Washington responded on March 12 by authorizing a 30-million-barrel release from the Strategic Petroleum Reserve, the largest draw since Libya’s civil war in 2011. Yet prices kept climbing, underscoring how psychological premiums can overwhelm physical injections. “The SPR is designed for supply outages, not shipping lane intimidation,” said Bob McNally, president of Rapidan Energy Group and a former White House adviser. “Markets want to see tankers moving, not barrels stored in Louisiana caverns.”
Refinery Bottlenecks Add Pressure
Domestic refining capacity is also a factor. U.S. operable refinery utilization stood at 86 percent the week ending March 14, seasonally high but still below the 90 percent threshold that typically cracks margins. Meanwhile, scheduled turnarounds in Texas and Illinois removed 400,000 barrels per day of processing capability just as gasoline demand rebounded to 9.1 million barrels per day—only 2 percent below pre-pandemic levels.
Environmental rules compound the squeeze. Summer-grade reformulated gasoline, required in much of the country by May 1, costs roughly 10–12 cents more to produce. Refiners have already begun switching units, so the seasonal premium is being layered on top of geopolitical risk. The result is a retail market where wholesale costs can rise 20 cents overnight, a volatility unseen since Libya’s 2011 outage.
Forward curves show Brent backwardation—the prompt contract trading above future months—at $5, a structure that incentivizes immediate sales and discourages storage. Until tanker traffic normalizes, that curve will keep gasoline on an upward trajectory regardless of SPR volumes.
Who Gets Hurt? Income, Region and Vehicle Type
Gasoline is one of the most regressive expenses in the U.S. budget. Bureau of Labor Statistics consumer-expenditure surveys show the bottom income quintile spends 8.8 percent of after-tax earnings on motor fuel, versus 2.9 percent for the top quintile. When prices spike 27 percent in four weeks, the lowest-earning fifth of households absorb an effective tax increase of roughly $340 a year—equivalent to one month of groceries.
Geography amplifies the burden. Rural drivers in Mississippi, West Virginia and New Mexico log 30 percent more miles than suburban commuters, yet earn 18 percent less on average. In these counties, pickup trucks comprise 45 percent of registered vehicles, compared with 25 percent nationally. Using EIA and Federal Highway Administration data, a 17-mpg truck driven 15,000 miles a year now costs $3,285 to fuel, up $705 since mid-February.
Urban professionals driving electric vehicles are largely insulated. EV registrations surpassed one million in 2025, and electricity prices have remained stable at 16.7 cents per kilowatt-hour, according to the Edison Electric Institute. A Tesla Model 3 traveling 1,000 miles consumes 25 kWh, costing $42—about one-third the expense of an average gasoline car even before the latest spike.
Policy Options and Political Fallout
State-level responses vary. Georgia suspended its 29-cent excise tax for the month of March, saving drivers roughly $3.50 per fill-up, while California lawmakers debated a rebate tied to income rather than fuel use. Congressional Democrats revived talk of a federal “gas price gouging” bill, though similar legislation stalled in 2022 after failing to define excess margin thresholds.
Economists caution that price caps or export bans could backfire. A Council on Foreign Relations study of the 2022 EU energy interventions found that rationing distorts demand signals and discourages investment. Instead, targeted rebates—modeled on Alaska’s Permanent Fund—tend to preserve price elasticity while cushioning low-income households. “The key is not to blunt the price signal, but to offset its distributional impact,” said Amy Myers Jaffe, managing director of the Climate Policy Lab at Tufts University.
Looking ahead, the Energy Information Administration’s Summer Fuels Outlook due in April will likely revise its forecast for average 2026 gasoline demand downward by 100,000 barrels per day, the first demand erosion projection since the 2008 financial crisis. If prices stay above $3.60, cumulative consumption could fall 1.2 percent year-over-year, trimming U.S. carbon emissions but also threatening federal highway funding tied to fuel-tax receipts.
Will Prices Keep Climbing, and Could Demand Destruction Follow?
Futures markets signal more volatility. The Nymex RBOB gasoline contract for April delivery settled at $3.05 per gallon on March 17, implying a retail ceiling near $3.90 once taxes and margins are added. Options skew—the premium of out-of-the-money call options—has risen to 9 percent, the highest since the Arab Spring in 2011, indicating traders are paying up for protection against further spikes.
Yet demand may buckle. Mastercard SpendingPulse data for the week ended March 15 show gasoline station receipts up 24 percent in dollars but only 1 percent in volume, evidence that consumers are cutting trips. Airline bookings for Memorial Day weekend, released March 18, dropped 3 percent versus 2025, the first year-over-year decline in a decade outside of pandemic years.
Historical precedent offers a guide. After the 2008 price peak above $4.10, U.S. gasoline demand fell 6 percent over the following 18 months and did not recover to pre-crisis levels for six years. Today’s fleet is 12 percent more efficient, and EV penetration is five times higher, so the demand destruction threshold could be lower. Analysts at Wood Mackenzie estimate that every sustained 50-cent increase above $3.50 trims 180,000 barrels per day from consumption within six months.
Global Recession Risk and the Fed’s Dilemma
Macroeconomic spillovers loom. A rule of thumb cited by the Federal Reserve Board is that a one-dollar rise in retail gasoline sustained for a year shaves 0.4 percentage points off real GDP growth. With current futures implying a 70-cent average increase for 2026, the hit to growth could reach 0.3 points—enough to complicate the Fed’s inflation fight should core services remain sticky.
Internationally, Asia’s importers are even more exposed. China’s crude import bill has jumped $45 billion annually at current prices, while India’s trade deficit widened to 2.1 percent of GDP, the highest since 2013. Both nations are expected to release strategic stocks in coordinated action with the U.S. this spring, a move that could shave $5 off Brent but still leave gasoline above year-ago levels.
Bottom line: unless Hormuz traffic resumes, Americans should brace for $4 gasoline by Memorial Day, a psychological threshold that historically triggers behavioral change—carpooling, transit ridership and, ultimately, demand destruction that could finally cap the rally.
What Can Washington Actually Do Before Election Day?
With the mid-term elections eight months away, lawmakers are under pressure to appear responsive without exacerbating supply shortages. The White House has ruled out a repeat of last year’s proposed federal gas-tax holiday, citing CBO estimates that only 30 percent of the savings reach consumers. Instead, the administration is weighing a variable export-licensing regime that would require Gulf Coast refiners to demonstrate 30 days of domestic inventory cover before shipping gasoline abroad.
The idea is controversial. American Fuel & Petrochemical Manufacturers, a refining trade group, warns that export restrictions could backfire by depressing domestic crude prices and incentivizing producers to cut investment. A 2022 CRS analysis found that export bans during Hurricane Katrina did little to lower retail prices because global traders simply rerouted cargoes, leaving net supply unchanged.
Congressional Democrats are coalescing around a rebate proposal sponsored by Senator Jack Reed of Rhode Island that would send $150 monthly electronic payments to households earning under $75,000 for as long as retail gasoline stays above $3.50. The plan would be funded by repealing $6 billion in accelerated depreciation for integrated oil companies, a move that the Joint Committee on Taxation says would be revenue-neutral over ten years.
The Strategic Petroleum Reserve Reality Check
Meanwhile, the SPR has fallen to 347 million barrels, the lowest since 1984, after the 30-million-barrel release. Energy Secretary Arvind Subramanian told reporters on March 17 that an additional 40 million barrels could be tendered this summer, but only if Congress passes emergency legislation waapping the 30-day consultation requirement. Such a draw-down would leave the reserve at roughly 300 million barrels, below the International Energy Agency’s 90-day import-cover mandate.
Republicans counter that long-term solutions require expanding domestic production. The House Energy & Commerce Committee advanced a bill on March 16 that would streamline pipeline permitting and reopen Alaska’s Arctic National Wildlife Refuge to leasing, provisions likely dead on arrival in the Senate. Industry executives privately acknowledge that even if ANWR opened tomorrow, first oil would not flow for eight years, too late to affect current prices.
The most immediate lever may be diplomatic. The State Department is quietly assembling a maritime escort coalition—similar to Operation Earnest Will in 1987—to escort tankers through Hormuz. Analysts at ClearView Energy Partners estimate that credible escort operations could shave $12 off Brent within a month, translating to roughly 30 cents at the pump. Whether such a coalition can be stood up before the summer driving season remains the trillion-dollar question for American motorists—and for the politicians who hope to retain their support.
Frequently Asked Questions
Q: Why did gas prices rise so fast in March 2026?
Fighting in Iran blocked tanker traffic through the Strait of Hormuz, removing about 20 million barrels per day of seaborne crude from the market and sending U.S. regular gasoline from $2.90 to $3.70 a gallon in four weeks.
Q: How does the 2026 spike compare with past shocks?
The 27 percent four-week gain is the second-largest since at least 1990, trailing only Hurricane Katrina’s 30 percent jump in September 2005 and exceeding the 24 percent surge after Russia invaded Ukraine in 2022.
Q: Which states are paying the most at the pump?
New Mexico leads with a $1.18 gain to $3.79 a gallon, followed by Arizona up $1.17 to $4.33 and Colorado up $1.06 to $3.82; California remains highest in absolute terms at $5.53.
Q: What does the jump cost a typical driver?
A 1,000-mile monthly driver in an average 25-mpg car now pays $32 more per month; a 17-mpg truck owner pays $47 extra, while a 52-mpg hybrid driver sees a $16 increase.
📰 Related Articles
- Middle East War Blocks Key LNG Route, Sparks Asian Coal Comeback
- Exxon, Chevron and ConocoPhillips Tell Trump Team Hormuz Disruptions Will Prolong Fuel Squeeze
- Oil Prices Surge Past $100 as Iran Intensifies Drone Strikes on Energy Sites
- Exxon, Chevron Tell Trump Team Hormuz Disruption Could Push Oil Past $100
