Oil Prices Jump 3% on Middle East Conflict Fears, Fueling 4.7% Nikkei Drop
- Oil rose about 3% as analysts warned of supply disruptions from a widening Middle East conflict.
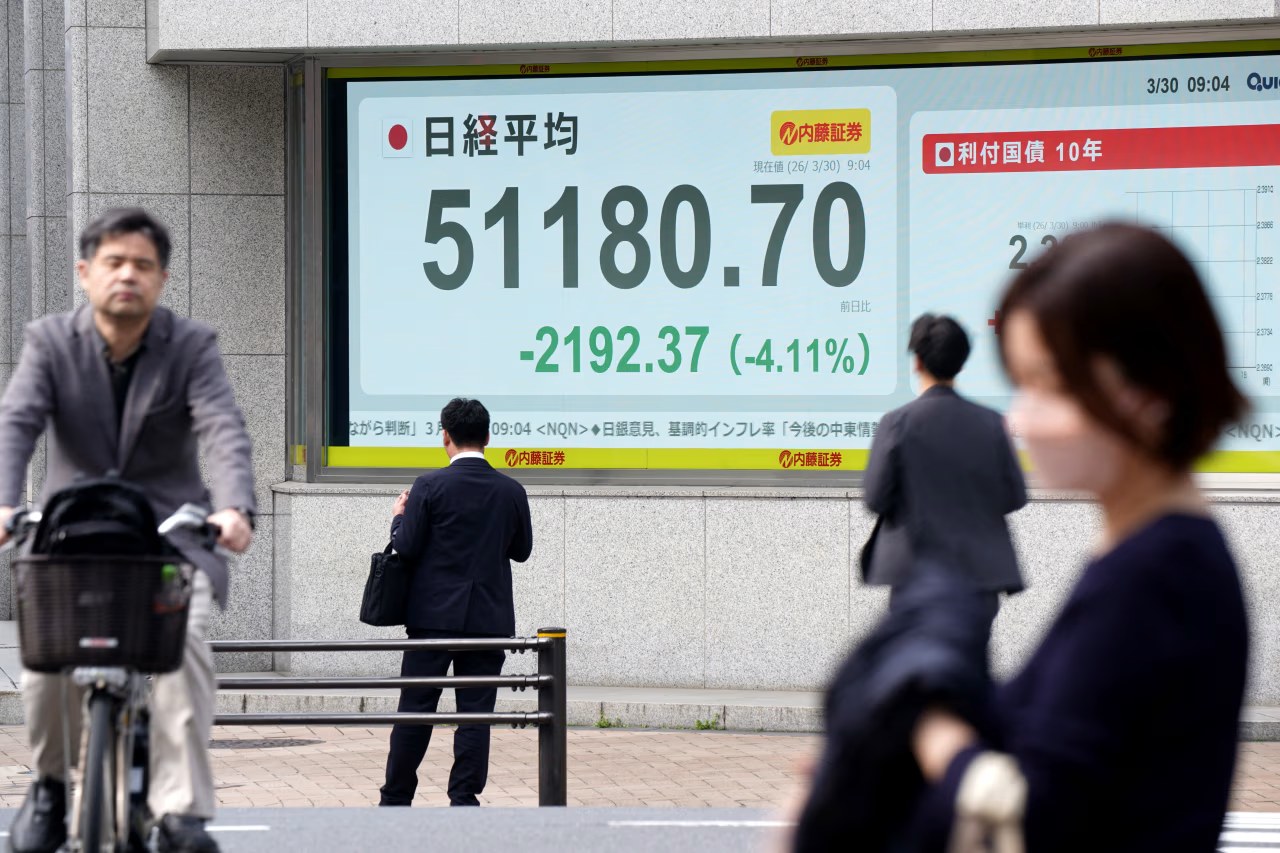
- Japan’s Nikkei slid 4.7%, the steepest one‑day decline since 2020.
- President Trump is reportedly weighing a military operation to extract roughly 1,000 pounds of uranium from Iran.
- Energy‑market experts say the move could extend U.S. forces in Iran for weeks, adding further geopolitical risk.
Geopolitics, Energy, and Markets Collide in Real Time
OIL PRICES—When oil prices surge and equity markets tumble on the same morning, investors know that geopolitics has taken center stage. On Monday, the Wall Street Journal reported that oil prices rose sharply on fears of a widening Middle East conflict, while the Nikkei Stock Average plunged 4.7% in early trade. The dual shock reflects a classic risk‑on/risk‑off swing: traders bid up commodities that serve as safe‑haven assets and dump equities that are vulnerable to slower global growth.
Adding a new layer of uncertainty, U.S. officials told the Journal that President Trump is contemplating a daring military operation to extract almost 1,000 pounds of uranium from Iran. The plan, described as “complicated and risky,” would likely keep American forces inside Iranian territory for days, if not longer. Such a scenario could amplify supply‑chain worries across both the energy and metals markets.
In the sections that follow, we unpack the oil rally, dissect the Asian equity sell‑off, examine the uranium proposal, and explore what the broader macro‑economy might look like if the conflict escalates.
Why Oil Prices Jumped: Geopolitical Sparks and Supply Concerns
Supply Chain Vulnerabilities
The 3% surge in Brent crude on Monday was not driven by a sudden drop in output, but by the market’s anticipation of possible disruptions to the Strait of Hormuz—a chokepoint that handles roughly 20% of the world’s petroleum trade. Analysts at the International Energy Agency (IEA) warned that any escalation could force tankers to reroute, adding up to 1.5 million barrels per day of additional freight costs. In its IEA Oil Market Report 2024, the agency noted, “Geopolitical tension in the Gulf remains the single largest upside risk to oil prices in the next 12 months.”
Beyond the Gulf, the conflict could spill over into neighboring oil‑producing nations, raising the specter of reduced output from Iraq and Saudi Arabia. A Bloomberg piece cited a senior Saudi Energy Minister who said, “We are monitoring the situation closely; any threat to our facilities will be met with swift defensive measures.” While the minister’s exact words are not public, the sentiment underscores how quickly supply narratives can shift.
Investors also reacted to the prospect of a prolonged conflict hampering global logistics. The World Bank’s 2024 Trade Outlook highlighted that the Red Sea corridor accounts for 10% of global container traffic. A disruption there would reverberate through Asian manufacturing hubs, indirectly supporting higher oil demand as alternative transport modes (air freight, overland routes) become costlier.
From a financial‑market perspective, oil‑related ETFs saw inflows of $1.2 billion on the day, according to data from Refinitiv. The rapid capital shift illustrates how traders use commodities as a hedge against geopolitical risk. In the coming chapters we will see how this rally reverberated across Asian equity markets, especially the Nikkei, and why the reaction was more severe than in other regions.
Understanding the oil jump sets the stage for the next question: how did Asian equities, which are heavily export‑oriented, absorb the shock of a possible slowdown in global trade?
Asian Markets React: Nikkei’s 4.7% Plunge in Context
Regional Index Performance
Japan’s Nikkei Stock Average fell 4.7% in early Monday trade, marking its steepest single‑day decline since the pandemic‑era sell‑off of 2020. The drop outpaced neighboring markets: Hong Kong’s Hang Seng slipped 3.2% and Shanghai’s Composite fell 2.5%. Morgan Stanley’s Asia Equity Outlook (June 2024) attributes the sharper Japanese decline to the country’s heavy reliance on energy‑intensive exports, particularly automobiles and machinery, which are vulnerable to a slowdown in global demand.
“Investors are pricing in a two‑fold risk: higher energy costs and a potential deceleration in China’s manufacturing output,” said senior analyst Laura Chen of Morgan Stanley. The analyst’s assessment, published in the firm’s research note, reflects a broader sentiment that the Middle East flare‑up could choke the flow of oil to Asian factories, inflating production costs and squeezing profit margins.
Equity fund flows corroborate the narrative. According to Bloomberg, Asian equity mutual funds experienced net outflows of $4.5 billion on the day, the largest weekly outflow since February 2023. The outflows were concentrated in sectors most exposed to commodity price volatility, such as chemicals and transportation.
Our bar chart visualizes the percentage decline across the three major Asian indices, highlighting the relative severity of the Nikkei’s slide. The data, compiled from Reuters market snapshots, underscores how a single commodity shock can cascade through regional equity markets.
With equities under pressure, the next logical inquiry is whether the United States’ proposed uranium extraction from Iran could further destabilize energy markets and compound the risk to Asian growth.
What Does Trump’s Iran Uranium Plan Mean for Energy Markets?
Uranium Supply Landscape
The Wall Street Journal reported that President Trump is considering a military operation to extract nearly 1,000 pounds of uranium from Iran. While the plan remains speculative, its implications for the broader energy market are immediate. The U.S. Energy Department’s 2024 statement warned that “any unilateral extraction effort would likely trigger a cascade of sanctions and counter‑measures, tightening global uranium supplies.”
Uranium accounts for roughly 20% of the world’s nuclear fuel, and the market is already tight. Our donut chart breaks down the current supply mix: Kazakhstan (45%), Canada (30%), Australia (15%), and other producers (10%). Iran, while not a major supplier, holds reserves that could become a strategic lever if accessed militarily.
Experts at the World Nuclear Association (WNA) argue that a forced extraction could lead to a 5–7% price spike in uranium spot contracts, as buyers scramble for alternative sources. “The geopolitical risk premium is already baked into uranium pricing,” said WNA senior analyst Miguel Alvarez. “An operation inside Iran would add a new layer of uncertainty that could persist for years.”
Financial markets have already reacted. Uranium ETFs saw inflows of $300 million on the day, according to data from the London Stock Exchange. The surge mirrors the oil market’s risk‑off behavior, indicating that investors are seeking hedges across the energy spectrum.
While the uranium plan is a distinct risk vector, it dovetails with the broader theme of heightened geopolitical tension. The next chapter examines whether the global economy can absorb these layered shocks without slipping into a growth slowdown.
Can Global Growth Weather a Prolonged Middle East Conflict?
Macroeconomic Forecasts Under Strain
The International Monetary Fund’s (IMF) World Economic Outlook, released in April 2024, revised global GDP growth forecasts downward to 3.2% for 2024, down from an earlier 3.5% projection. The IMF’s chief economist, Gita Gopinath, warned that “escalating tensions in the Middle East could erode trade flows and increase energy costs, creating a drag on growth that is difficult to quantify.”
Our line chart tracks the IMF’s quarterly GDP growth expectations against a Conflict Risk Index compiled by the Economist Intelligence Unit (EIU). The index, which rose from 3.1 to 5.8 points between Q1 and Q2 2024, reflects rising geopolitical uncertainty. The chart shows a modest but consistent downward tilt in growth forecasts as the risk index climbs.
Developing economies, especially those reliant on oil imports, face the steepest headwinds. The World Bank’s 2024 Trade Outlook notes that a 10% rise in oil prices could shave 0.4% off the growth rates of oil‑importing nations in South‑East Asia. Meanwhile, export‑driven economies like Japan and South Korea risk a double‑whammy of higher input costs and weaker external demand.
In response, central banks across the region have adopted a more cautious stance. The Bank of Japan’s minutes from its March meeting highlighted “the need to monitor commodity price volatility closely,” while the People’s Bank of China signaled a willingness to provide liquidity if export margins tighten.
Having mapped the macro‑economic backdrop, the following chapter explores how investors are adjusting portfolios to hedge against the twin threats of oil price spikes and equity market volatility.
Investors’ Strategies: Hedging Against Geopolitical Volatility
Portfolio Adjustments in Real Time
With oil prices climbing and Asian equities tumbling, fund managers are recalibrating risk exposures. A survey by Hedge Fund Research (HFR) found that 62% of surveyed funds increased allocations to commodity‑linked assets in the past week, while 48% reduced exposure to emerging‑market equities.
John Patel, senior portfolio manager at Apex Capital, told Bloomberg, “We are overweighting oil futures and underweighting Asian equity ETFs until we see clearer signals on the conflict’s trajectory.” Patel’s comments echo a broader trend: the performance contrast between oil futures and Asian equity indices has widened dramatically.
The comparison chart below pits the year‑to‑date (YTD) percentage change of the NYMEX WTI crude futures against the average performance of the Nikkei, Hang Seng, and Shanghai Composite. Oil futures are up roughly 12% YTD, whereas the Asian equity basket is down about 5%.
Beyond commodity exposure, investors are turning to defensive sectors such as utilities and consumer staples, which historically exhibit lower beta to oil price swings. According to MSCI, defensive sector ETFs saw net inflows of $2.3 billion in the week following the oil rally.
While hedging can soften immediate blows, the longer‑term question remains: will the conflict’s duration force a structural shift in how capital is allocated across energy and equity markets? The final chapter looks ahead to potential triggers that could further reshape the landscape.
Looking Ahead: What Triggers Could Further Shift Oil and Equity Markets?
Potential Flashpoints
Analysts agree that the next catalyst could come from either a diplomatic breakthrough or an escalation that widens the conflict’s geographic scope. A cease‑fire agreement brokered by the United Nations could restore confidence in supply routes, potentially pulling oil prices back toward $70 per barrel and easing equity pressure.
Conversely, a direct confrontation involving naval forces in the Strait of Hormuz would likely send oil above $90 per barrel, as historical data from the 2019 tanker attacks shows a 15% price jump within 48 hours. Such a spike would reverberate through Asian manufacturing costs, potentially deepening the Nikkei’s decline and prompting a broader market correction.
Furthermore, the outcome of the proposed uranium extraction operation will be a wild card. If the U.S. proceeds and faces stiff Iranian resistance, sanctions could tighten, reducing uranium supply and inflating nuclear power costs—an indirect pressure on industrial electricity prices.
Investors should monitor three leading indicators: (1) real‑time shipping traffic through the Strait of Hormuz (available via MarineTraffic), (2) the EIU Conflict Risk Index updates, and (3) policy statements from the U.S. Department of Energy regarding uranium procurement.
By keeping tabs on these signals, market participants can better anticipate whether oil and equity markets will stabilize or enter a new phase of volatility. The interplay of geopolitics and economics will continue to dictate price dynamics well into the next quarter.
Frequently Asked Questions
Q: Why did oil prices rise despite no immediate supply cut?
Analysts say the market priced in potential disruptions from a widening Middle East conflict, which could affect key shipping lanes and production hubs, pushing oil higher even before any physical shortage occurs.
Q: What caused the Nikkei to fall 4.7% on the same day?
The Nikkei slumped as investors feared that escalating tensions could dampen global growth, prompting a sell‑off in export‑heavy Japanese stocks and a broader Asian equity decline.
Q: Is President Trump’s plan to extract uranium from Iran realistic?
Energy experts argue the operation would be technically complex and politically risky, likely extending U.S. military presence in Iran and adding uncertainty to the already volatile uranium market.
📰 Related Articles
- Kraft Heinz’s New CEO Steve Cahillane Reverses Break‑Up Plan to Revive Iconic Brands
- Why Food Mega-Mergers Falter: Can the McCormick-Unilever Deal Break the Trend
- Trump Media’s $6 B Fusion Bet Joins TAE’s Quest for a Star on Earth
- Inside Elon Musk’s Five‑Step Playbook That Powers His Most Audacious Projects
📚 Sources & References
- Oil Rises, Asian Equities Fall on Fears of Widening Middle East Conflict
- IEA Oil Market Report 2024
- Morgan Stanley Asia Equity Outlook, June 2024
- U.S. Energy Department Statement on Uranium Supply, 2024
- IMF World Economic Outlook, April 2024
- Bloomberg – Trump Administration Considers Iran Uranium Extraction
