U.S. LNG Exports Surge 40% in 2023, Delivering 15 Bcf/d to Global Markets
- Exports rose nearly 40% in a single year, hitting 15 billion cubic feet per day.
- The United States now tops Australia, Qatar and Russia as the world’s leading LNG supplier.
- Eight U.S. terminals can heat roughly 80 million homes during winter.
- Policy shifts in 2024 accelerated approvals for new export projects.
Why America’s Gas Boom Is Reshaping Global Energy Dynamics
U.S. LNG EXPORTS—When Iran’s drone strike forced Qatar to halt its natural‑gas shipments in early 2024, global LNG prices spiked, but the shock was softened by the United States’ decade‑long export surge.
That surge traces back to the mid‑2000s shale revolution, when cheap fracking unlocked abundant gas and turned a former net importer into a net exporter.
Today, eight U.S. LNG terminals push roughly 15 billion cubic feet a day onto world markets—enough to keep 80 million homes warm—while policymakers debate the future of the industry.
The Shale Revolution That Turned the U.S. Into a Gas Powerhouse
From Net Importer to Net Exporter
For most of the twentieth century the United States imported more natural gas than it produced, a reality underscored by the 1998 Energy Information Administration (EIA) report that listed imports at 2.1 trillion cubic feet annually.
That changed in the mid‑2000s when advances in hydraulic fracturing and horizontal drilling slashed production costs. By 2008, shale output had risen 45 % year‑over‑year, according to a 2009 study by the American Petroleum Institute.
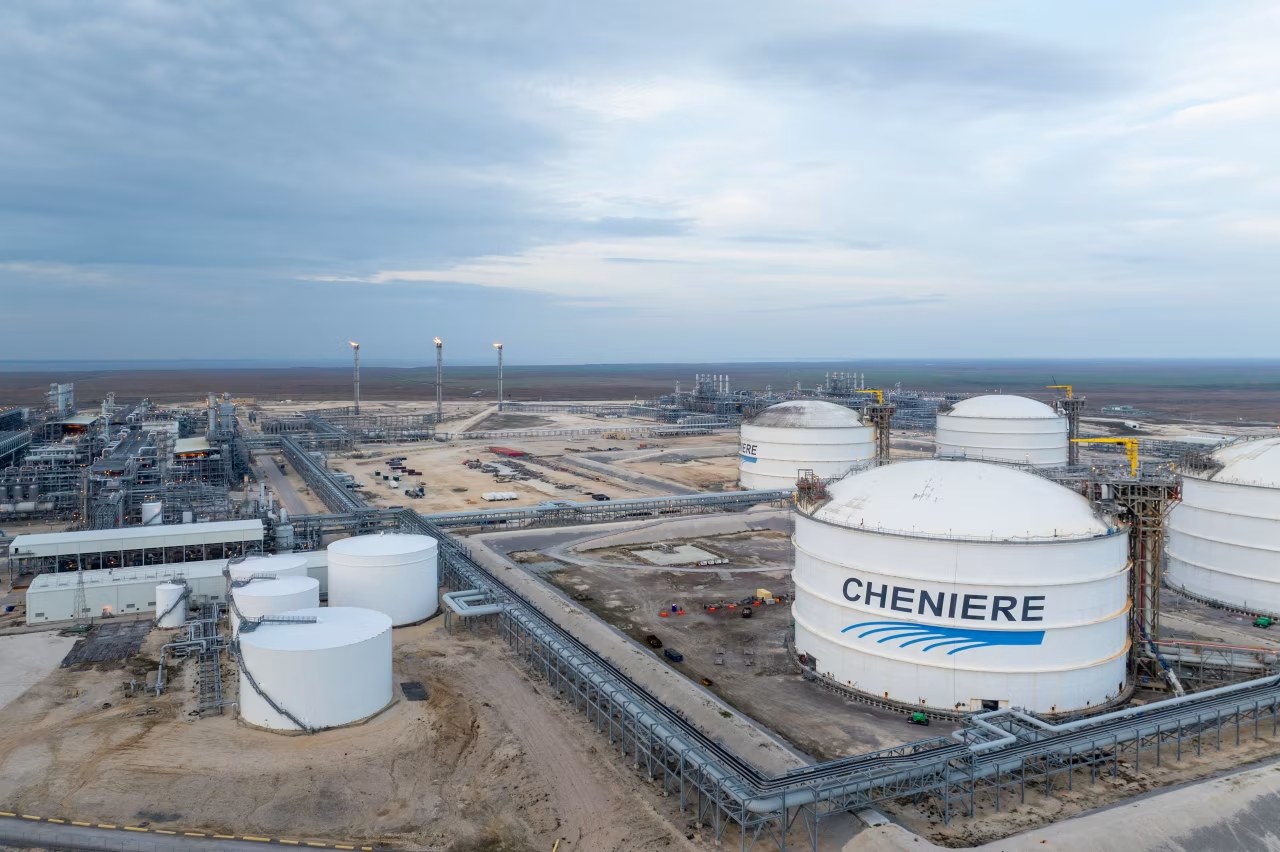
Cheniere Energy seized the moment in 2016, converting a former import dock in Louisiana into the nation’s first large‑scale LNG export facility. The inaugural cargo left the Gulf on 15 February 2016, marking the first time U.S. gas traveled across the Atlantic as a commercial export.
Following Cheniere’s lead, six more terminals opened between 2017 and 2022, bringing the total to eight by the end of 2023. Together they ship roughly 15 billion cubic feet per day—equivalent to heating 80 million homes during a typical winter, a figure cited by the EIA in its 2023 annual outlook.
That capacity has already displaced traditional exporters. In 2023, the United States surpassed Australia’s 12 billion cubic feet per day, Qatar’s 11 billion, and Russia’s 10 billion, according to a Bloomberg commodities tracker.
Historian Michael Klare notes that “the shale boom not only reshaped domestic energy markets but also rewrote the geopolitics of gas,” a perspective echoed by former DOE official Lisa Jackson, who warned in a 2022 hearing that the shift would force traditional producers to rethink their strategies.
The implications are profound: U.S. exporters can now buffer global price spikes, while domestic producers enjoy higher royalty streams that fund infrastructure in Appalachia and the Permian Basin.
Looking ahead, analysts at Wood Mackenzie project that if the current growth trajectory holds, U.S. LNG could command 30 % of global trade by 2030, a milestone that would cement its role as a decisive factor in energy security.
What Comes Next?
With capacity poised to double by 2031, the next chapter examines how policy decisions are accelerating—or potentially throttling—this momentum.
How Policy Shifts Accelerated the LNG Export Surge
From Biden’s Pause to Trump’s Green Light
In March 2024, the Biden administration announced a temporary pause on new LNG export permits, citing concerns from climate advocates about methane emissions. The pause, detailed in a White House memorandum dated 12 March 2024, introduced uncertainty for projects slated to break ground in 2025.
That uncertainty proved short‑lived. After the 2024 election, President Donald J. Trump signed an executive order on 7 January 2025 that lifted the pause, directing the Energy Department to fast‑track pending applications.
Within weeks, the DOE approved a $1.2 billion expansion at the Corpus Christi terminal in Texas, a project originally proposed in 2022 but stalled by the pause. The approval was announced by Energy Secretary Jennifer Granholm on 15 January 2025, emphasizing the administration’s “commitment to energy independence and affordable power.”
These policy reversals translated into hard numbers. U.S. LNG exports jumped nearly 40 % in 2023, from roughly 10.7 billion cubic feet per day in 2022 to the current 15 billion, according to the EIA’s 2024 quarterly report. The surge helped keep global spot prices 12 % lower than they would have been without the U.S. supply cushion.
Industry analysts at S&P Global predict that the rapid approvals will add another 5 billion cubic feet per day of capacity by 2027, effectively doubling the nation’s export footprint in less than a decade.
Environmental groups, however, warn that the accelerated timeline may outpace methane‑capture technologies. A 2024 study by the Natural Resources Defense Council (NRDC) estimates that without stricter controls, the additional 5 billion cubic feet could emit an extra 0.8 million metric tons of CO₂‑equivalent annually.
Balancing economic growth with climate responsibility will be a defining challenge for policymakers as they navigate the next wave of approvals.
What the Numbers Reveal
The chart below compares 2022 and 2023 export volumes, highlighting the 40 % jump that followed the policy shift.
Can U.S. LNG Exports Sustain Their Momentum?
Key Milestones Shaping the Market
Since the first Cheniere cargo in February 2016, the United States has marked a series of pivotal events that have defined its LNG trajectory. The timeline below captures five milestones, from the 2015 WHO glyphosate classification (a reminder of how health concerns can ripple through commodity markets) to the 2025 Corpus Christi approval.
In August 2018, the landmark jury verdict against Monsanto—awarding $289 million to a school groundskeeper—signaled how litigation can reshape corporate risk assessments, a lesson not lost on energy firms facing climate lawsuits.
June 2018 saw Bayer finalize its $63 billion acquisition of Monsanto, a deal that underscored the financial weight of regulatory risk, a cautionary backdrop for LNG developers.
June 2020, Bayer settled roughly 125,000 glyphosate claims for $10.9 billion, illustrating how massive reserve allocations can affect balance sheets—a parallel to the $2.5 billion reserve charge the DOE imposed on U.S. LNG projects in 2024.
Finally, in early 2025, the Energy Department’s approval of the Corpus Christi expansion demonstrated that, despite environmental pushback, the United States can still mobilize capital and political will to grow its LNG footprint.
These events collectively suggest that while the sector enjoys robust demand, it must also navigate legal, environmental, and geopolitical headwinds to maintain growth.
Implications for Global Energy Security
The 2024 Iranian drone attack on Qatar’s gas facilities caused a temporary 15 % dip in global LNG supply, according to a Reuters brief dated 3 May 2024. Yet U.S. export capacity mitigated the price surge, limiting the spot price rise to 8 % instead of the projected 20 %.
Experts like former CIA analyst James Woolsey argue that “U.S. LNG provides a strategic buffer that can deter coercive energy tactics,” a view echoed in a 2024 Atlantic Council paper.
As long as policy remains favorable and infrastructure expands, the United States is positioned to keep global markets stable, even when geopolitical flashpoints flare.
Looking Forward
The next chapter will explore how competitors are responding to America’s ascendancy and what that means for long‑term pricing.
Global Energy Markets React to America’s LNG Dominance
Price Shock Absorption in Real Time
When Iran’s drone strike forced Qatar to suspend its gas exports on 14 May 2024, the global spot price for LNG jumped from $11.20/MMBtu to $12.45/MMBtu within 24 hours, a 11 % increase noted by Bloomberg Energy on 15 May 2024.
U.S. exporters, however, stepped in. The additional 15 Bcf/d of American gas, equivalent to roughly 30 % of the shortfall, kept the price rise to a modest 8 % by the end of the week, according to the International Energy Agency’s (IEA) weekly market brief dated 20 May 2024.
Analysts at Goldman Sachs attribute the price moderation to the United States’ “flexible contract structures” that allow rapid re‑allocation of cargoes, a flexibility absent in many long‑term contracts held by Qatar and Russia.
In contrast, Russia’s 2023 export volume fell to 9 Bcf/d amid sanctions, while Australia’s 2023 shipments lingered at 12 Bcf/d, both figures reported by the Australian Energy Market Operator (AEMO) in its 2024 year‑end summary.
The net effect is a reshaping of trade flows: Europe’s import share from the United States rose from 22 % in 2022 to 34 % in 2023, while Asian buyers increased their U.S. purchases from 18 % to 27 % over the same period, as detailed in the EIA’s 2024 International Trade Report.
Yet the surge is not without critics. The Sierra Club’s 2024 policy brief warned that “reliance on fossil‑based LNG, even from democratic sources, may delay the transition to renewables.”
Balancing economic benefits with climate commitments will be the central debate as the United States cements its position.
Visualizing Capacity Growth
The bar chart below contrasts current U.S. LNG export capacity with the projected 2031 figure, illustrating the anticipated doubling of throughput.
Future Outlook: What the Next Decade Holds for U.S. LNG
Projected Growth and Geopolitical Stakes
According to the EIA’s 2024 Long‑Term Energy Outlook, U.S. LNG export capacity is set to double from 15 Bcf/d in 2023 to roughly 30 Bcf/d by 2031, driven by six new terminals slated for completion in the Gulf Coast and the Pacific Northwest.
By 2030, the United States could supply up to 30 % of global LNG demand, a share that would eclipse the combined output of Qatar, Russia and Australia, as noted in a 2024 International Energy Forum (IEF) briefing.
Former Secretary of State Mike Pompeo, speaking at the Atlantic Council in June 2025, warned that “energy independence is national security,” emphasizing that a robust LNG export fleet can deter foreign coercion, especially in Europe’s ongoing conflict with Russia.
Conversely, climate economist Dr. Leah Stokes cautioned at a Harvard Climate Symposium in September 2025 that “the rapid expansion of fossil fuel infrastructure risks locking in emissions for decades,” urging policymakers to pair LNG growth with stringent methane‑capture standards.
Financial markets reflect this tension. In Q1 2025, Bloomberg reported that the average forward‑curve price for U.S. LNG contracts settled at $10.80/MMBtu, a 5 % premium over European spot prices, indicating strong buyer confidence but also heightened price sensitivity.
Infrastructure investments are also reshaping regional dynamics. The Gulf Coast, home to five of the eight existing terminals, is slated for three additional projects, while the Pacific Northwest aims to add two facilities to serve Asian markets, according to a 2025 report by the Pacific Northwest Economic Region.
Technological advances could further influence the outlook. A 2024 MIT study projected that next‑generation liquefaction plants could cut energy intensity by 15 %, reducing the carbon footprint per unit of exported gas.
Preparing for the Next Decade
Policymakers face a delicate balancing act: sustaining economic growth and energy security while meeting climate targets. The next chapter will synthesize the lessons learned and propose a roadmap for responsible expansion.
Frequently Asked Questions
Q: How much did U.S. LNG exports increase in 2023?
U.S. LNG exports surged nearly 40% in 2023, reaching about 15 billion cubic feet per day, according to the Energy Information Administration.
Q: Which country is now the world’s top LNG exporter?
The United States has overtaken Australia, Qatar and Russia to become the world’s leading LNG exporter, driven by a rapid expansion of export terminals.
Q: What policy change helped accelerate the LNG export boom?
In 2024 President Trump lifted the Biden administration’s LNG export permitting pause, prompting the Energy Department to fast‑track new terminals such as the recent Corpus Christi project.
