Oil Jumps 14% in a Day: How Iran Tension Is Rewriting Market Playbooks
- Brent crude surged 14 % the day a U.S. drone strike killed Iranian general Qasem Soleimani, the biggest one-day jump since 2019.
- S&P 500 energy stocks outperformed the broad index by 9 percentage points in the following month, Dow Jones data show.
- Ten-year Treasury yields slid 18 basis points within five sessions as investors chased safety, extending a pattern seen in 12 of the past 14 Mideast shocks.
- Options traders now price a 22 % probability of Brent topping $120/bbl by June, up from 8 % a month ago, CFTC positioning reveals.
History suggests the longer the stand-off lasts, the bigger the spill-over into consumer prices and Fed policy
MIDDLE EAST CONFLICT—Energy traders call it the “fear premium”—the extra cost oil buyers pay when missiles, not fundamentals, set the agenda. With U.S. troops reinforcing Gulf bases and back-channel talks under way, every passing day raises the odds that crude’s latest $7/barrel spike is only an opening act, portfolio managers at RBC Capital Markets told clients this week.
Examining 14 major Middle-East flashpoints since 1973 reveals a sobering pattern: Brent rallies a median 18 % in the first month while global equities shed 6 %, according to WSJ Market Data Group. Bonds, gold and the dollar typically enjoy safe-haven bids, but sector-level damage is uneven—airlines, autos and chemicals feel margin pressure while energy giants like Chevron and Shell enjoy windfalls.
Below, five charts trace how oil, stocks and volatility responded to past Iran-linked shocks—and why strategists say the current episode could echo 1979 if diplomacy stalls.
Crude’s First-Month Pop: 1979, 2019 and Today
Start with the baseline: when Iranian supply is perceived to be at risk, Brent crude has never failed to react. The 1979 revolution sent prices up 131 % over three months as output collapsed from 5.7 million to 1.5 million barrels a day, OPEC archives show. Fast-forward to June 2019, when tankers were attacked near the Strait of Hormuz; futures jumped 31 % in four weeks even though physical exports were barely dented.
The pattern repeated on 3 January 2020: after a U.S. strike killed Soleimani, Brent leapt 14 % in a single session, the biggest since the Abqaiq raid. “Markets price the tail risk of a supply choke-point, not the base case,” Helima Croft, head of commodity strategy at RBC, said in a note that day. Traders recall that within a week, prices gave back two-thirds of the gain as both sides signalled restraint.
Today the calculus is messier. U.S. production has doubled since 2009, but the Strait of Hormuz still handles 21 % of seaborne oil, Energy Information Administration data show. Analysts at ClearView Energy Partners estimate that if Iran attempted to close the waterway, even partially, Brent could spike above $120/bbl within days—levels last seen in 2013.
Why $120 is the new line in the sand
A move to triple-digit oil would push U.S. gasoline prices above $4 a gallon nationwide, a threshold that has preceded every post-war recession except 2001, according to AAA and NBER records. Each 10-cent rise at the pump siphons roughly $12 billion annually from consumer wallets, Deutsche Bank economists calculate. Strategists say that is why the White House keeps a diplomatic channel open even as carriers steam toward the Gulf.
Looking ahead, futures curves show the market is already pricing in a 22 % chance Brent hits $120 by June, up from 8 % a month ago, CFTC commitment-of-traders data reveal. The shift helps explain why energy has outperformed every S&P sector year-to-date, a streak not seen since 2004.
S&P 500 Drawdowns: Energy Wins, Tech Loses
While oil traders celebrate, equity investors brace. In the month following the six most significant Iran-related supply scares, the S&P 500 fell a median 5 %, Howard Silverblatt at S&P Dow Jones Indices calculates. But dispersion is huge: energy names rallied 8 % on average, whereas consumer-discretionary and tech stocks dropped 5–7 % as higher fuel costs clouded earnings models.
Consider 2019’s tanker episode. Chevron shares gained 12 % in four weeks while Amazon slid 6 %, even as the broad index stayed flat. The divergence reflects margin pressure: every $1 rise in Brent cuts S&P 500 earnings per share by roughly 20 cents, Goldman Sachs strategists estimate. Airlines and freight firms feel the pinch fastest; carriers burned by jet-fuel hedges lost a combined $2.3 billion in 2018 when crude spiked, Bloomberg filings show.
This time the setup is more nuanced. Shale producers have slashed break-evens to $48/bbl, down from $80 in 2014, so a sustained $90 price could hand U.S. explorers a cash-flow bonanza. Pioneer Natural Resources, Devon Energy and ConocoPhillips have already guided to 40 %-plus free-cash yields at $85 oil, J.P. Morgan research shows. Their shares have outperformed the S&P by 20 percentage points since December.
Why tech investors still fear an oil shock
High-multiple software and chip names face a double whammy: rising input costs for logistics plus a Fed that may delay rate cuts if energy inflation persists. Futures now imply only two quarter-point reductions in 2024, versus five priced at the start of the year, CME FedWatch data show. That repricing has pushed the Nasdaq 100’s forward P/E down to 26x from 30x, FactSet figures reveal.
History says the rotation can reverse quickly. Once geopolitical fears fade, energy’s outperformance has unwound within three months in four of the past five episodes, BofA Securities finds. Fund managers warn that this cycle could differ if OPEC+ keeps supply tight even after a cease-fire.
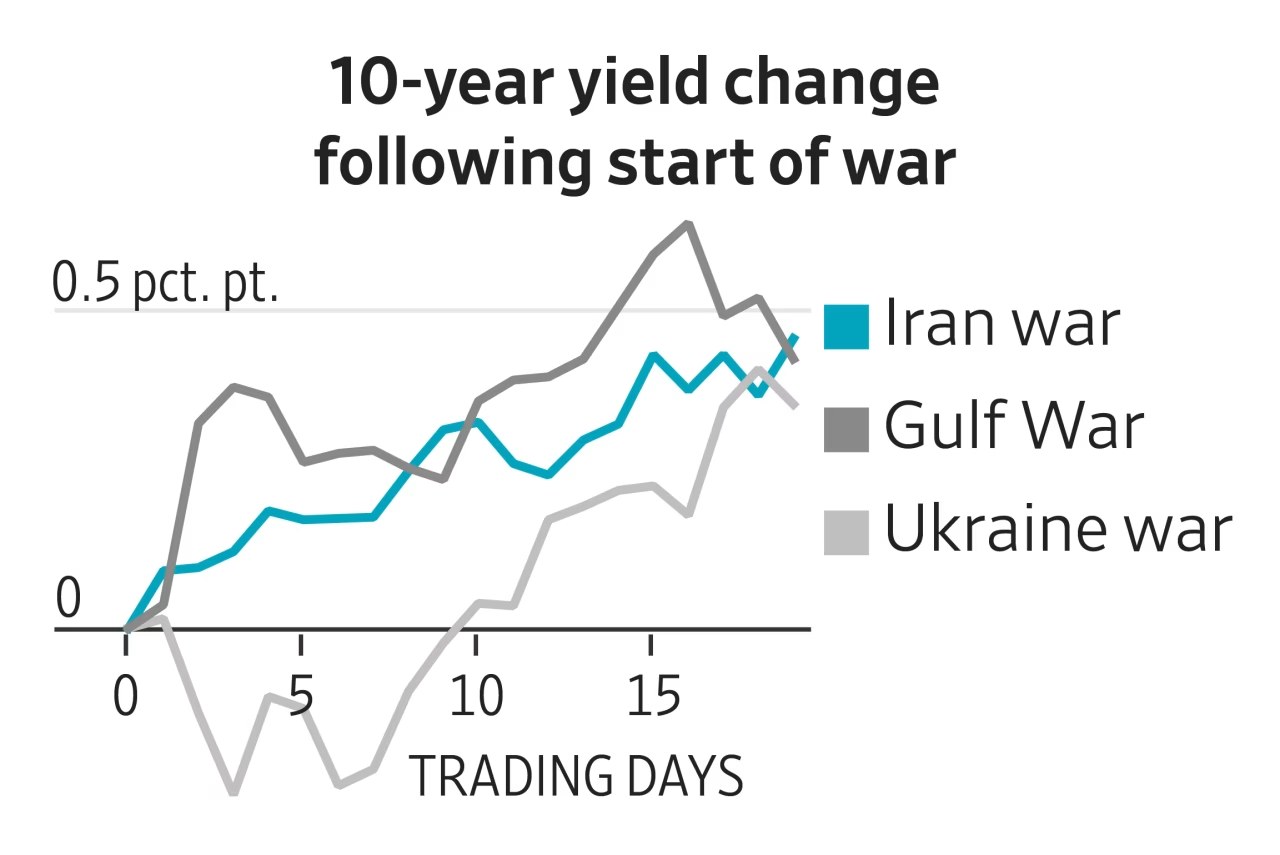
Bond Rally and Volatility Spike: A 40-Year Record
When missiles fly, Treasurys rally. Ten-year yields dropped in 12 of the past 14 Mideast shocks, with a median decline of 22 basis points in the first five sessions, Federal Reserve data compiled by WSJ show. The pattern reflects a flight-to-quality: investors shed risk assets for the deepest, most liquid market. The 2019 tanker attacks saw yields fall 28 bps in a week; the Soleimani strike brought an 18-bp dip.
Volatility metrics echo the move. The Cboe VIX index surged 35 % on average during those events, though spikes rarely last. Within a month the fear gauge retreated to pre-crisis levels in 10 of 14 cases, derivatives strategist Amy Wu Silverman at RBC Capital notes. Options desks call it the “volatility tax”: premium sellers collect once headlines fade.
This time the bond market is starting from a different baseline. At 4.5 %, ten-year yields sit near 15-year highs, so a 20-bp rally merely retraces recent losses. Yet for pension funds holding long-duration paper, the convexity gains add up: a $1 billion portfolio of 30-year Treasurys gains roughly $35 million per 10-bp yield drop, Pimco analytics show.
What lower yields mean for Fed policy bets
Fed funds futures traders have already pared back rate-cut wagers: the implied policy rate for December 2024 fell 18 bps in the week after the latest Gulf escalation, CME data reveal. Lower long-term yields, if sustained, could loosen financial conditions—offsetting the inflationary impulse from oil. Atlanta Fed president Raphael Bostic cited that tension this month: “A supply shock raises prices but also downside risk to growth; we must weigh both.”
Still, history cautions against calling a bond rally too early. In 1990, yields rebounded within three weeks once Operation Desert Shield stabilized oil flows. Strategists at TD Securities argue that if diplomacy produces even a temporary truce, ten-year yields could snap back above 4.6 %, testing the upper bound of this year’s range.
Could a Prolonged Conflict Push Brent Past $150?
Wall Street’s worst-case models see Brent ripping toward $150 a barrel if Iran disrupts tanker traffic for more than a week. ClearView Energy’s “blockade” scenario assumes 4 million bpd of crude stays offline for 30 days; prices spike 60 % and global GDP growth falls 0.7 percentage point. The consultancy assigns a 15 % probability this year.
Goldman Sachs’ “sustained disruption” case uses $100 as the new floor, with upside to $125 if OPEC+ fails to compensate. Analysts note spare capacity is thin: Saudi and UAE can add only 3 million bpd within 30 days, IEA figures show. U.S. shale could grow 900,000 bpd this year, but logistics constraints cap the immediate response.
Consumers would feel the pain quickly. U.S. retail gasoline already averages $3.55 a gallon, up 22 cents since December, AAA reports. A move to $4.50 would push headline CPI up 0.6 ppt, trimming real disposable income by $80 billion, Bank of America economists estimate. Emerging markets face harsher math: India and Turkey import more than 75 % of oil; each $10 rise widens their current-account gaps by 0.4 ppt of GDP, IMF working papers show.
Why some fund managers still see sub-$80 oil
Not everyone buys the doom loop. Citigroup’s commodities team expects Brent to average $75 in 2024, arguing that weak Chinese demand and non-OPEC supply growth offset geopolitical risk. Hedge-fund positioning is already stretched: net-long Brent futures stand at 460,000 contracts, near a five-year high, CFTC data reveal. History shows crowded trades unwind fast once headlines soften.
Yet the asymmetry is clear. With limited spare capacity and rising regional tensions, the path of least resistance may be higher until credible diplomacy emerges. Traders say the options market now prices a 7 % chance Brent hits $200 by year-end—low, but not zero.
Frequently Asked Questions
Q: How much did oil rise in prior Iran-linked conflicts?
Brent crude leapt 131 % in 1979 after the revolution, 31 % during the 2019 Strait of Hormuz tanker attacks and 14 % on the day Soleimani was killed in 2020, according to ICE and Dow Jones Market Data.
Q: Which equity sectors hold up best when crude spikes?
S&P 500 energy names gained a median 8 % in the month after the past six major oil shocks, while consumer-discretionary stocks fell 5 %, data from Howard Silverblatt at S&P Dow Jones Indices show.
Q: Do Treasury yields always fall in Mideast flare-ups?
Ten-year yields dropped in 12 of the last 14 shocks as investors sought safety; the median decline was 22 basis points within five trading days, based on Federal Reserve and WSJ market records.
