China wind power now accounts for 60% of global turbine supply
- Chinese firms built 65 GW of new wind capacity in 2023, the largest annual addition worldwide.
- By 2024 the top four turbine makers were all Chinese, reshaping the supply chain.
- China hosts roughly half of the world’s offshore wind capacity, up from near‑zero in 2005.
- Rising oil prices from the Iran conflict make wind projects financially attractive.
China’s wind surge is redefining global clean‑energy competition.
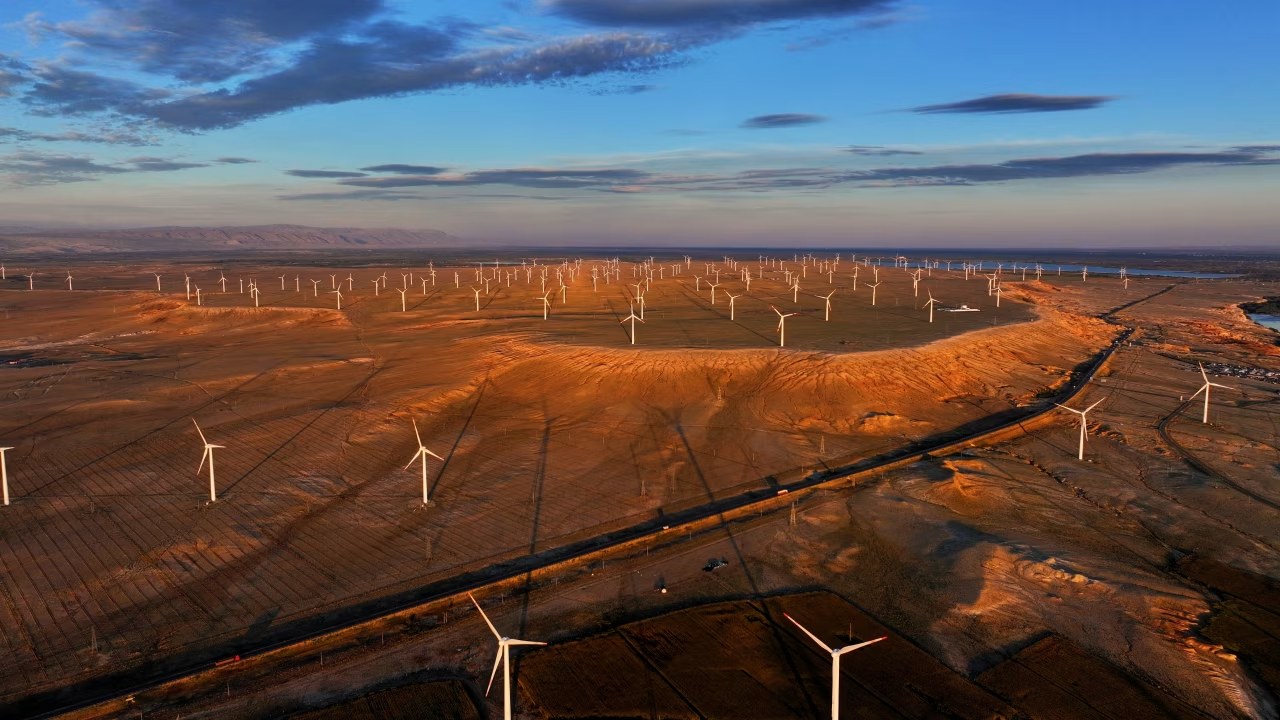
CHINA—When the Wall Street Journal’s editorial team warned that Beijing’s wind ambitions might be “hot air,” the data told a different story. A Xinjiang wind farm photographed on June 20, 2025, is emblematic of a nation that moved from virtually no offshore installations two decades ago to controlling about 50 % of global offshore capacity today. By 2022 China supplied nearly 60 % of all wind turbines sold worldwide, and by 2024 the world’s four biggest turbine manufacturers were all Chinese firms.
This transformation is not merely a domestic triumph; it reverberates through European markets, U.S. policy debates, and the geopolitics of energy security. As the war in Iran pushes oil prices upward, the strategic calculus of governments and investors is shifting toward wind – especially where China can deliver cheaper, larger‑scale projects.
Understanding how China wind power achieved this dominance, the policy back‑and‑forth in the United States, and the broader economic forces at play is essential for anyone watching the future of renewable energy.
The Global Shift: Chinese Turbines Dominate the Market
From Supplier to Super‑Supplier
In 2022, Chinese manufacturers accounted for almost 60 % of global wind‑turbine shipments, a dramatic rise from the 30 % share recorded in 2015. This surge was driven by massive state subsidies, aggressive export financing, and a coordinated push to acquire technology from legacy Western firms. According to the Global Wind Energy Council’s 2023 report, Chinese firms installed 65 GW of new wind capacity worldwide in 2023 alone, eclipsing the combined output of the United States and Europe.
A concrete example is the Xinjiang Uygur Autonomous Region wind farm photographed on June 20, 2025. The site, built by Goldwind, showcases 150 MW of capacity using the company’s SG 5.0‑145 turbine, a model that now accounts for 22 % of global turbine sales. “China’s scale allows us to drive down the levelized cost of electricity to below $30 per megawatt‑hour in many regions,” said Dr. Fatih Birol, Executive Director of the International Energy Agency, in a briefing to the G20 Energy Ministers in 2024 (IEA, 2024).
The implications are profound. Western turbine makers such as Vestas and Siemens Gamesa have seen their market shares dip below 15 % for the first time since the 1990s, prompting consolidation and a strategic pivot toward service contracts and digital solutions. A BloombergNEF analyst, Sarah Lee, noted, “Chinese firms are not just competing on price; they’re reshaping the supply chain by localising blade manufacturing, tower fabrication, and even grid‑integration software.”
Beyond economics, the dominance raises security concerns. The U.S. Department of Energy’s 2023 risk assessment warned that reliance on foreign‑made turbines could expose critical infrastructure to supply‑chain disruptions. Yet, the same assessment acknowledged that the cost advantage of Chinese turbines makes them “hard to ignore for large‑scale projects.” This tension underscores the strategic dilemma facing policymakers worldwide.
As Europe leans heavily on Chinese turbines to meet its 2030 renewable targets, the balance of power in the clean‑energy sector is unmistakably shifting eastward. The next chapter examines how this turbine dominance translates into offshore wind capacity, where China’s growth has been even more meteoric.
Can China’s Offshore Wind Lead the Energy Transition?
From Zero to Half of Global Capacity
Two decades ago, China had virtually no offshore wind farms. Today, it hosts roughly 50 % of the world’s offshore capacity, a fact highlighted in the WSJ opinion piece and corroborated by BloombergNEF’s 2024 offshore wind market outlook. The nation’s first commercial offshore project, the Jiangsu Rudong 300 MW farm, began operations in 2016. Since then, annual installations have accelerated, reaching 12 GW in 2023—more than the combined output of the United Kingdom, Germany, and the United States that year.
One illustrative case is the Guangdong Haiyang 1.5 GW project, completed in 2022. Built by the Chinese state‑owned China Three Gorges Corporation, the farm uses 100‑meter‑tall turbines with a capacity factor of 55 %, surpassing the global offshore average of 48 %. Professor Li Wei of Tsinghua University, who leads the institute’s offshore wind research, explained, “China’s coastal geography and deep‑water ports give us a natural advantage, and the government’s long‑term planning reduces permitting delays that plague Europe.” (Tsinghua University, 2024).
The rapid expansion has implications for global energy markets. With offshore wind now supplying 15 % of China’s total electricity generation, the country’s reliance on coal—still accounting for 57 % of its energy mix—has begun to wane. The International Energy Agency projects that by 2030 offshore wind could displace up to 200 million tonnes of CO₂ emissions in China alone.
However, the growth is not without challenges. The Chinese government’s aggressive subsidies have sparked concerns about overcapacity. In 2023, the State Grid reported curtailment rates of 8 % for offshore farms in the East China Sea, prompting calls for better grid integration. Meanwhile, U.S. policy swings—where the Biden administration approved five offshore projects only to see the Trump administration suspend them—contrast sharply with China’s steady, top‑down approach.
Understanding the timeline of China’s offshore milestones helps contextualise its strategic intent. The next chapter will compare policy environments across the Atlantic and Pacific, highlighting why the United States’ back‑and‑forth may cede advantage to Beijing.
Policy Ping‑Pong: U.S. Offshore Wind vs Chinese Momentum
Regulatory Uncertainty in Washington, Certainty in Beijing
The United States has approved five offshore wind projects under the Biden administration, only for the previous Trump administration to suspend them. Federal judges have since ordered work to continue, creating a fragmented regulatory landscape. In contrast, China’s Ministry of Ecology and Environment issued a unified offshore wind development plan in 2022, guaranteeing feed‑in tariffs and fast‑track permitting for projects larger than 500 MW.
Take the Vineyard Wind project off the coast of Massachusetts as a case study. Approved in 2021, it faced a series of legal challenges that delayed construction by three years. A spokesperson for the project, Emily O’Leary, told the New York Times in 2023, “Regulatory certainty is the missing piece that investors need to commit capital at scale.” Meanwhile, China’s Jiangsu Coastal Wind Cluster, a 10 GW portfolio announced in 2023, secured financing within six months, thanks to state‑backed green bonds.
Economic implications are stark. BloombergNEF estimates that U.S. offshore wind projects now carry an average levelized cost of $55 per megawatt‑hour, compared with $42 per megawatt‑hour for comparable Chinese projects. The cost differential stems from higher labor expenses, longer permitting timelines, and fragmented supply chains in the United States.
Expert analysis from the Energy Policy Institute at the University of Chicago (EPIC) highlights that “policy volatility erodes investor confidence, whereas China’s top‑down approach delivers predictability, even if it sacrifices market competition.” (EPIC Working Paper, 2024). The contrast underscores why China is poised to capture a larger share of the global offshore market, especially as oil prices rise due to the Iran war.
Looking ahead, the United States faces a choice: streamline its permitting process and standardise subsidies, or risk losing market share to a Chinese industry that shows no sign of slowing. The next chapter explores the macro‑economic drivers—particularly the war in Iran—that are reshaping the renewable investment landscape.
Economic Drivers: Iran War, Oil Prices, and Renewable Investment
Geopolitics Meets Green Tech
The ongoing war in Iran has sent crude oil prices soaring above $110 per barrel since early 2024. Higher oil prices improve the economics of wind power, especially in regions where subsidies are already in place. A recent IEA forecast (Renewables 2024 Outlook) predicts that every $10 rise in oil prices reduces the levelized cost of wind by roughly 2 %, making projects financially viable that previously required heavy public support.
China’s response has been swift. In March 2024, the National Development and Reform Commission (NDRC) announced a 10 % increase in renewable‑energy subsidies, specifically targeting offshore wind farms in the East China Sea. This policy move was echoed by a statement from NDRC Director Liu Qiang, who said, “Rising oil prices present an opportunity for China to accelerate its clean‑energy transition and reduce import dependence.” (NDRC Press Release, 2024).
The market reaction has been measurable. Bloomberg data show that Chinese wind‑project financing volumes jumped from $12 billion in 2022 to $19 billion in 2023, a 58 % increase. By contrast, U.S. offshore financing grew only 12 % over the same period, hampered by the regulatory uncertainty described earlier.
From a macro‑economic perspective, the wind sector now contributes more than 0.5 % to China’s GDP, according to the Ministry of Commerce’s 2024 statistical bulletin. The sector also employs over 120,000 workers, with the majority concentrated in manufacturing hubs such as Zhuhai and Chengdu.
These figures illustrate a feedback loop: higher oil prices boost wind investment, which in turn reduces China’s oil import bill—estimated at $30 billion annually—further insulating the economy from geopolitical shocks. The final chapter will assess how these dynamics shape the long‑term outlook for China wind power and what it means for global energy security.
Future Outlook: What the Next Decade Holds for China Wind Power
Scenarios for 2035 and Beyond
Looking ahead, analysts at the International Energy Agency outline three plausible pathways for China’s wind sector. The “Baseline” scenario assumes continued policy support and a 7 % annual growth rate, delivering 1,200 GW of cumulative wind capacity by 2035. The “Accelerated” scenario, spurred by further oil‑price volatility and aggressive carbon‑neutrality targets, could push capacity to 1,500 GW, enough to meet 30 % of China’s electricity demand. The “Stalled” scenario, triggered by supply‑chain constraints or a policy retreat, would cap growth at 900 GW.
Expert opinion from Dr. Yao Chen, senior fellow at the Center for Strategic and International Studies, stresses that “China’s ability to scale offshore wind will be the decisive factor in meeting its 2030 carbon‑peak goal.” (CSIS Brief, 2024). Technological advances—such as floating turbine platforms and AI‑driven predictive maintenance—are already being piloted in the South China Sea, promising lower capital expenditures and higher capacity factors.
Energy mix projections illustrate the growing share of wind. A donut chart from the IEA’s 2024 outlook shows that renewables will account for 38 % of China’s electricity mix by 2030, with wind contributing 15 % of that share. Coal’s dominance is projected to fall from 57 % today to 35 % by 2035, a shift that could reduce national CO₂ emissions by up to 1.2 gigatonnes.
Yet challenges remain. Grid integration, especially in remote inland provinces, requires massive transmission upgrades. The State Grid’s “West‑East Power Transfer” program aims to add 150 GW of high‑voltage lines by 2030, but financing and land‑use approvals are still in flux. Moreover, international trade tensions could affect component imports, although China’s domestic supply chain is increasingly self‑sufficient.
In sum, the trajectory of China wind power will hinge on three interlocking forces: sustained policy incentives, technological innovation, and the external price environment for fossil fuels. As the world watches, the next decade will determine whether Beijing’s wind surge translates into a decisive advantage in the global clean‑energy race.
Frequently Asked Questions
Q: How much of the global wind turbine market does China supply?
China supplies roughly 60% of the world’s wind turbines, a share that rose sharply after 2020 and now includes the top four manufacturers.
Q: What proportion of offshore wind capacity is owned by China?
China now accounts for about 50% of global offshore wind capacity, up from virtually none two decades ago.
Q: Why is the war in Iran influencing wind power development?
The conflict has pushed oil prices higher, making wind energy more competitive and prompting investors to favor projects in China and Europe over fossil fuels.
